
 Yahoo Finance
 Crude Oil Price Update – Trader Reaction to $40.65 Sets the Tone
U.S. West Texas Intermediate crude oil prices are edging lower on Monday after giving back earlier gains. Shortly after the opening, the market was boosted by tighter global supplies and a series of economic reports that show growth in the global economy. Just like last week, traders appear to be shrugging off a surge in coronavirus infections.
At 12:31 GMT, August WTI crude oil is trading $40.58, down $0.07 or -0.17%.
The OPEC+ and U.S. production cuts are helping to underpin prices along with the gradual reopening of the U.S. economy, however, there are possible headwinds that could slow down the rally or even trigger a short-term correction. The main headwind is the labor market. There is some fear that the surge in COVID-19 cases could lead to layoffs in the U.S. which would hurt fuel demand. We’ll know more about that on Thursday with the release of the Weekly Initial Claims report.
Daily Swing Chart Technical Analysis
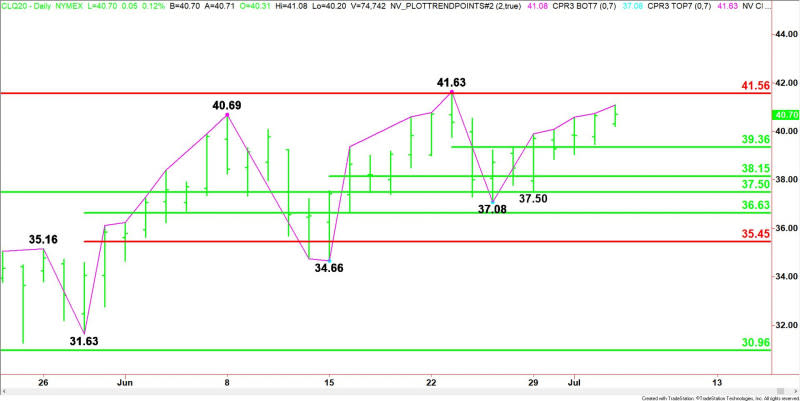
The main trend is up according to the daily swing chart. A trade through $41.63 will signal a resumption of the uptrend. A move through $37.08 will change the main trend to down.
On the upside, the resistance is a long-term Fibonacci level at $41.56.
The short-term range is $41.63 to $37.08. Its 50% level at $39.36 is support.
Daily Swing Chart Technical Forecast
Today’s session begins with the market up six days from its last main bottom. This means we should start watching for signs of a top although the 7-10 day period is better.
This puts Thursday’s close at $40.65 in focus.
Bullish Scenario
A sustained move over $40.65 will indicate the presence of buyers. If this creates enough upside momentum then look for the buying to possibly extend into the resistance cluster at $41.56 to $41.63.
Bearish Scenario
A sustained move under $40.65 will signal the presence of sellers. If there is a follow-through to the downside then look for the selling to possibly extend into the minor pivot at $39.36.
For a look at all of today’s economic events, check out our economic calendar.
This article was originally posted on FX Empire
