
 Yahoo Finance
 Crude Oil Price Update – Needs to Hold Above $57.41 to Sustain Rally
U.S. West Texas Intermediate crude oil futures inched higher on Friday before finishing the session slightly higher. Traders said the buying dried up as profit-takers hit the market after word came out that President Trump had cancelled an attack on Iran.
Heightened tension over U.S.-Iran relations was one theme driving prices higher last week. Prices were also underpinned by a weaker U.S. Dollar, a bigger-than-expected drop in U.S. stockpiles and the hope of a trade deal between the U.S. and China after President Trump announced he would meet with China President Xi Jinping at the G-20 meeting in Osaka, Japan this weekend.
On Friday, August WTI crude oil settled at $57.43, up $0.36 or +0.63%.
Daily Swing Chart Technical Analysis
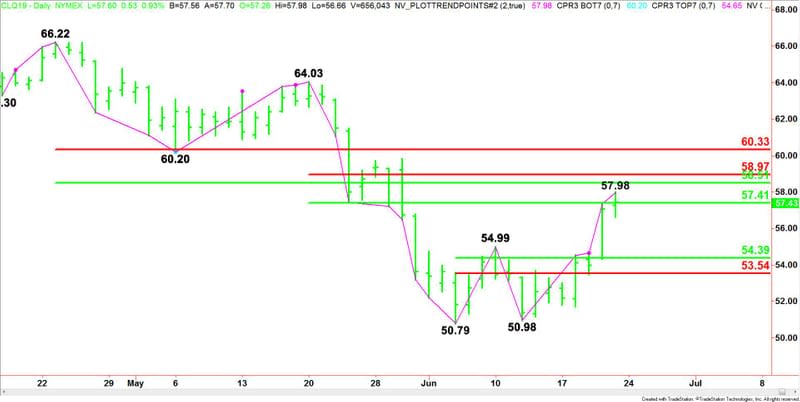
The main trend is up according to the daily swing chart. The trend turned up on Thursday when buyers took out the previous main top at $54.99.
A trade through $50.98 will change the main trend to down. This is not likely, however, Monday’s session will be the eighth day up from the last main bottom so there is the possibility of a closing price reversal top.
The short-term range is $50.79 to $57.98. Its retracement zone at $54.39 to $53.54 is support.
The intermediate range is $64.03 to $50.79. Its retracement zone at $54.41 to $58.97 was tested on Friday when the market hit $57.98.
The long-term range is $66.22 to $50.79. Its retracement zone at $58.51 to $60.33 is the primary upside target.
Combining the intermediate and long-term retracement zones creates a potential resistance zone at $58.51 to $58.97. Sellers could come in on a test of this area.
Daily Swing Chart Technical Forecast
Based on Friday’s price action and the close at $57.43, the direction of the August WTI crude oil futures contract on Monday is likely to be determined by trader reaction to the intermediate 50% level at $57.41.
Bullish Scenario
A sustained move over $57.41 will indicate the presence of buyers. If this creates enough upside momentum then look for buyers to make a run at Friday’s high at $57.98, followed closely by the long-term 50% level at $58.51 and the intermediate Fibonacci level at $58.97.
If sellers can’ stop the market at $58.97 then look for a potential acceleration to the upside with the long-term Fibonacci level at $60.33 the next target.
Bearish Scenario
A sustained move under $57.41 will signal the return of sellers. This could trigger the start of a steep break with the short-term retracement zone at $54.39 to $53.54 the next major downside target.
This article was originally posted on FX Empire
