
 Yahoo Finance
 Crude Oil Price Update – Buying Looks Tentative as Market Approaches Major Resistance Levels
U.S. West Texas Intermediate crude oil futures are trading higher early Thursday, helped by a bigger-than-expected draw in U.S. government crude inventories and signs of growing fuel demand. The price action indicates that the supply/demand situation is the number one concern with traders as most of the major players have chosen to shrug off the strength in the U.S. Dollar.
At 06:32 GMT, December WTI crude oil futures are trading $71.99, up $0.10 or +0.14% and December Brent crude oil futures are at $75.47, up $0.08 or +0.11%.
Crude inventories fell by 3.5 million barrels in the week to September 17 to 414 million barrels, compared with analysts’ expectations in a Reuters poll for a 2.4 million-barrel drop.
Undercutting the optimism, U.S. gasoline stocks rose by 3.5 million barrels to 221.6 million barrels, compared with expectations for a 1.1 million-barrel drop. Distillate stockpiles, which include diesel and heating oil, fell by 2.6 million barrels versus expectations for a 1.2 million-barrel drop.
Daily Swing Chart Technical Analysis
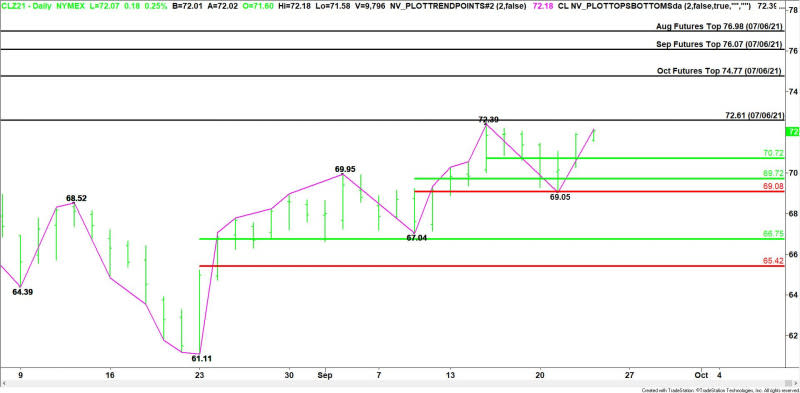
The main trend is up according to the daily swing chart. A trade through $72.39 will signal a resumption of the uptrend. A move through $69.05 will change the main trend to down.
The minor range is $72.39 to $69.05. Its 50% level at $70.72 is the nearest support.
The short-term range is $67.04 to $72.39. Its retracement zone at $69.72 to $69.08 is the key support area. This zone stopped the selling at $69.05 on September 21.
The main range is $61.11 to $72.39. If the main trend changes to down then look for the selling to possibly extend into its retracement zone at $66.75 to $65.42.
Daily Swing Chart Technical Forecast
The direction of the December WTI crude oil market on Wednesday is likely to be determined by trader reaction to $71.89.
Bullish Scenario
A sustained move over $71.89 will indicate the presence of buyers. Taking out the intraday high at $72.18 will indicate the buying is getting stronger. This could trigger a surge into the September 15 main top at $72.39, followed by the July 6 main top at $72.61.
Trading conditions will get interesting if buyers can clear out the main top at $72.61. This is because the next targets are a series of main tops at $74.77, $76.07 and $76.98.
Bearish Scenario
A sustained move under $71.89 will signal the presence of sellers. The first downside target is the pivot at $70.72. Since the main trend is up, buyers could come in on the first test of this level.
If $70.72 fails as support then look for the selling to possibly extend into the 50% level at $69.72, followed by the support cluster at $69.08 – $69.05.
For a look at all of today’s economic events, check out our economic calendar.
This article was originally posted on FX Empire
More From FXEMPIRE:
Crude Oil Price Update – Buying Looks Tentative as Market Approaches Major Resistance Levels
Daily Gold News: Thursday, Sep. 23 – Gold Remains Above $1,750 Price Level
EUR/USD Forex Technical Analysis – Weakens Under 1.1690, Strengthens Over 1.1719
USD/CAD Exchange Rate Prediction – The Dollar Slides After Fed Decision
EOS, Stellar’s Lumen, and Tron’s TRX – Daily Analysis – September 23rd, 2021
Ethereum, Litecoin, and Ripple’s XRP – Daily Tech Analysis – September 23rd, 2021
