
 Yahoo Finance
 Crude Oil Price Update – August WTI Futures Need to Hold $39.36 to Sustain Rally
U.S. West Texas Intermediate crude oil futures are edging higher on Thursday as a sharp decline in U.S. oil inventories outweighed concerns that a surge in U.S. coronavirus infections and revived lockdown measures in California could curtail a recovery in fuel demand.
U.S. crude inventories fell 7.2 million barrels from a record high last week, far more than analysts had expected, U.S. Energy information Administration (EIA) data showed, as refiners ramped up production and imports eased.
At 11:44 GMT, August WTI crude oil is trading $40.07, up $0.25 or +0.63%.
Daily Swing Chart Technical Analysis
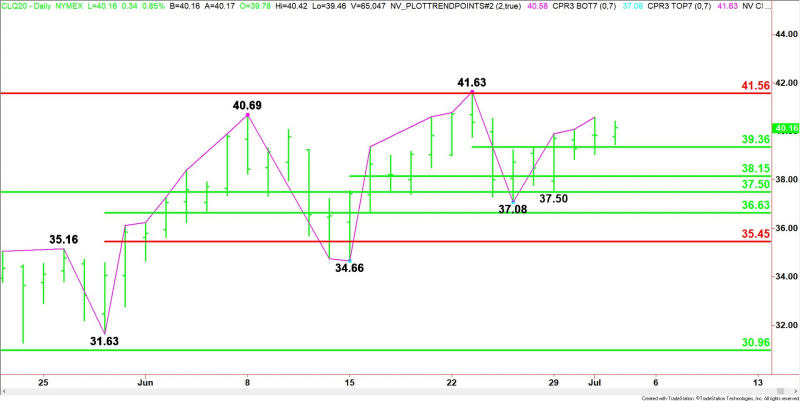
The main trend is up according to the daily swing chart. A trade through $41.63 will signal a resumption of the uptrend. A move through $37.08 will change the main trend to down.
The short-term range is $41.63 to $37.08. Its 50% level or pivot at $39.36 is providing support.
The intermediate range is $34.66 to $41.63. Its 50% level at $38.15 is another potential support level.
The main range is $31.63 to $41.63. If the trend changes to down then its retracement zone at $36.63 to $35.45 will become the next downside target area.
The major retracement zone controlling the longer-term direction of the market comes in at $37.50 to $41.56.
Daily Swing Chart Technical Forecast
Based on the early price action and the current price at $40.07, the direction of the August WTI crude oil market on Thursday is likely to be determined by trader reaction to the 50% level at $39.36.
Bullish Scenario
A sustained move over $39.36 will indicate the presence of buyers. If this move creates enough upside momentum then look for a near-term test of the resistance cluster at $41.56 to $41.63. The latter is a potential trigger point for an acceleration to the upside.
Bearish Scenario
A sustained move under $39.36 will signal the presence of sellers. This could lead to a labored break with potential support levels coming in at $38.15, $37.50 $37.08 and $36.63.
The selling will start to open up to the downside under $36.63.
Side Notes
A strong U.S. Non-Farm Payrolls report should be supportive for crude oil prices unless traders are looking beyond this “stale” report to a possible second wave of coronavirus infections.
For a look at all of today’s economic events, check out our economic calendar.
This article was originally posted on FX Empire
