
 Yahoo Finance
 Crude Oil and Gold Prices Face Renewed Selling Pressure
DailyFX.com -
Talking Points:
US Dollar Gains Most Since Mid-March, Breaks Monthly Trend
S&P 500 in Digestion Mode After Establishing New Record High
Gold Drops Most in 3 Weeks, Crude Oil Back Below $65 Figure
Can’t access the Dow Jones FXCM US Dollar Index? Try the USD basket on Mirror Trader. **
US DOLLAR TECHNICAL ANALYSIS – Prices issued the largest daily advance in two months, breaking above trend line resistance. A daily close above the 38.2% Fibonacci retracement at 11836 exposes the 50% level at 11898. Alternatively, a reversal below the 11748-59 area (range support, 23.6% Fib) opens the door for a challenge of the 14.6% retracement at 11711.
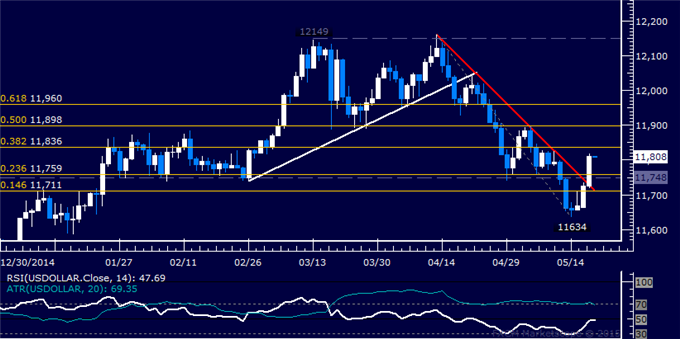
Daily Chart - Created Using FXCM Marketscope
** The Dow Jones FXCM US Dollar Index and the Mirror Trader USD basket are not the same product.
S&P 500 TECHNICAL ANALYSIS – Prices are consolidating after breaking range resistance and setting a new record high. From here, a daily close above the 50% Fibonacci expansion at 2140.70 exposes the 61.8% level at 2159.30. Alternatively, a move back below the 38.2% Fib at 2122.10 targets the 23.6% expansion at 2099.10.

Daily Chart - Created Using FXCM Marketscope
GOLD TECHNICAL ANALYSIS – Prices turned sharply lower, putting in the largest daily decline in three weeks. From here, a daily close below the 23.6% Fib expansion at 1193.38 targets the 1169.31-78.09 area (38.2% level, March 31 low). Alternatively, a turn above the 14.6% Fib at 1208.22 aims for the May 18 high at 1232.30.

Daily Chart - Created Using FXCM Marketscope
CRUDE OIL TECHNICAL ANALYSIS – Prices turned lower anew, slipping back below the $65/barrel figure. From here, a daily close below the 23.6% Fibonacci retracement exposes the 38.2% level at 60.27. Alternatively, a move above the 14.6% retracement at 66.03 targets the 14.6% Fib expansion at 67.78.
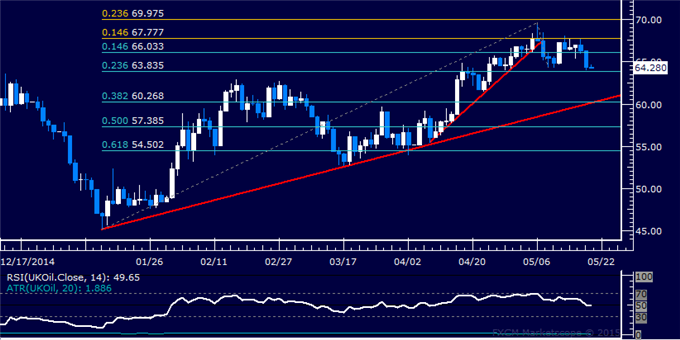
Daily Chart - Created Using FXCM Marketscope
--- Written by Ilya Spivak, Currency Strategist for DailyFX.com
To receive Ilya's analysis directly via email, please SIGN UP HERE
Contact and follow Ilya on Twitter: @IlyaSpivak
DailyFX provides forex news and technical analysis on the trends that influence the global currency markets.
Learn forex trading with a free practice account and trading charts from FXCM.
