
 Yahoo Finance
 Crude Oil Forecast September 25, 2017, Technical Analysis
WTI Crude Oil
The WTI Crude Oil market went back and forth on Friday, after initially dipping. By grinding back and forth, the market looks likely to see more consolidation, but given enough time, I believe that every time we get close to the $50 level, buyers will step in and try to lift this market. Breaking above the $51 level would be a very bullish sign, and should send this market much higher, perhaps the $52.50 level being targeted next. I believe in buying dips, and son until we break well below the $49 level that I would be concerned about the uptrend that we recently formed. If we break down below there, then I think we go much lower. I think it’s much more likely to break above the $52.50 level and go looking for $55 however.
Crude Oil Inventories Video 25.9.17
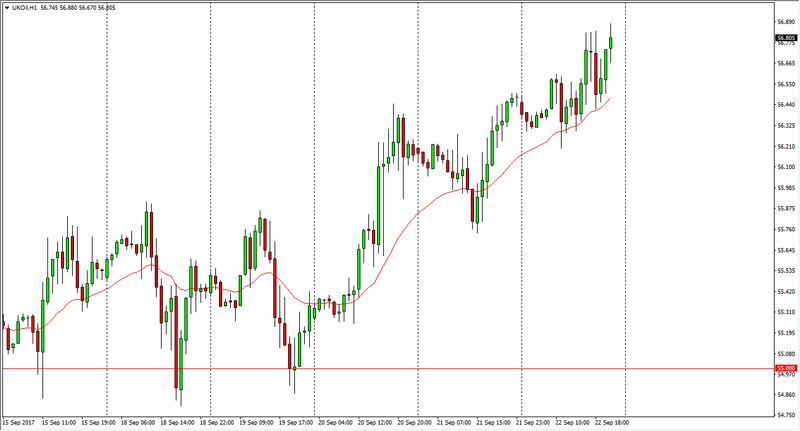
Brent
Brent markets rallied significantly during the year, but found enough trouble at the $57 level to turn around and form a shooting star on the hourly chart. It’s likely that a pullback from here will be bought, as there has been plenty of buying pressure underneath. I think that dips offer value that markets are likely going to try to get to the $60 handle given enough time. The $55 level underneath should be massively supportive as well, as it is a bit of a floor at the moment. The Brent markets have led the WTI market higher, and that being the case it’s likely that if we see a bullish move, the WTI market will follow it. With all of this volatility, I think that the longer-term minded trader is looking for higher pricing. Buying dips in small increments should end up being a very bullish situation as traders benefit from building large positions.
This article was originally posted on FX Empire
More From FXEMPIRE:
Dow Jones 30 and NASDAQ 100 forecast for the week of September 25, 2017, Technical Analysis
Dow Jones 30 and NASDAQ 100 Price Forecast September 25, 2017, Technical Analysis
E-mini Dow Jones Industrial Average (YM) Futures Analysis – September 22, 2017 Forecast
Dow Jones 30 and NASDAQ 100 Price Forecast September 22, 2017, Technical Analysis
