
 Yahoo Finance
 Crude Oil Dips to $56, Investors Eye U.S-China Talks
Crude oil has recorded losses of 1.4% on Friday, erasing the gains seen on Wednesday. In the North American session, West Texas Intermediate crude oil futures are trading at $56.21, up $0.85 or 1.50%. Brent crude oil futures are trading at $61.24, up $0.62 or 1.00%.
Will U.S-China Talks Fuel Crude Prices?
There is optimism in the markets that the U.S. and China are close to reaching an interim trade deal, known as “Phase 1”. This would allow the two countries to eliminate trade war tariffs, while leaving the most intractable issues for another round of negotiations. On Thursday, the Chinese commerce ministry announced that the two countries would phase out the trade war tariffs, but it did not provide a timetable for such a move. A new trade deal could significantly boost global trade, which has been hit hard by the ongoing U.S-China trade war. This has reduced the demand for oil, most notably in China, which is the world’s second-largest consumer of oil. If there are further signs that a trade deal is near, this would likely result in an increased demand for crude, creating upward pressure on crude prices.
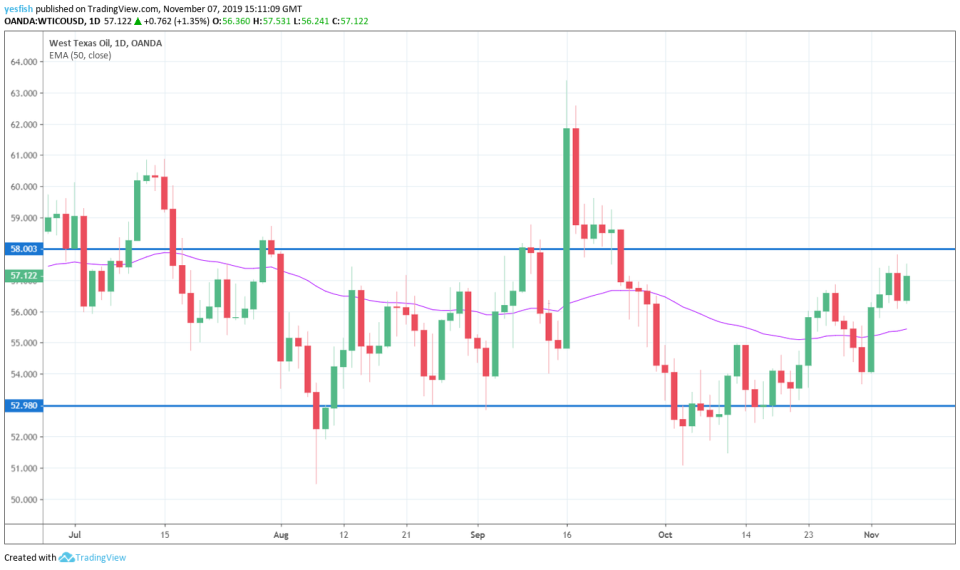
Crude Technical Analysis
I am keeping an eye on the 50-day and 200-day EMA lines. Crude is just above the 50-EMA, which is at 56.15. The 200-EMA is at 56.96, as it continues to flirt with the candlesticks. Crude broke above this line on Thursday, only to fall back below it in Friday’s Asian session. Crude has tested resistance at 57.65 this week, as this line remains under pressure. Above, we find resistance at 58.15. On the downside, there is support at the round number of 55.00. This is closely followed by support at 54.50.
This article was originally posted on FX Empire
More From FXEMPIRE:
USD/JPY Price Forecast – US Dollar Continues To Try To Break Out
GBP/USD Price Forecast – British Pound Pulls Back To Support
AUD/USD Price Forecast – Aussie Dollar To Continue Choppiness Due To Trade War Headlines
GBP/JPY Weekly Price Forecast – British Pound Choppy Against Japanese Yen
GBP/JPY Price Forecast – British Pound Continues To Consolidate Against Yen
