The Cost Difference Between Renting and Buying in America’s Largest Cities

One of the biggest financial decisions you will ever make is whether or not to purchase a home. The implications of this potential money move are only compounded if you find yourself in a larger city where the housing market is competitive and the cost of living is steep. With high interest rates on monthly mortgage payments, buying a house might seem out of the realm of possibility, but the upfront costs of a down payment would save you thousands of dollars when it comes to the true lifelong cost of renting.
Find Out: 8 Places Where Houses Are Suddenly Major Bargains
Read More: Become a Real Estate Investor for Just $1K Using This Bezos-Backed Startup
Long-term housing costs of your real estate, whether you are spending on monthly rent or building equity, tend to add up either way, but your decision to rent or buy could make the difference in achieving your savings goals. Paying property taxes and the concept of home equity may sound overwhelming, but when it comes down to the brass tacks benefits, what is really better for your buck?
GOBankingRates recently conducted economic research to determine the cost difference in home prices between renting and buying in some of the largest U.S. cities and metro areas. Here are a few key findings from 15 of the largest American cities.

New York City
Total population: 8,622,467
Median household income: $76,607
Average home value: $756,721
Average monthly mortgage payment: $4,481
Average monthly rent: $3,756
Homeowner monthly cost of living: $7,392
Renter monthly cost of living: $6,667
Learn More: 6 Best Cities To Buy Property in the Next 5 Years, According to Real Estate Agents
Trending Now: Mortgage Rates Are Dropping: 20 Housing Markets With the Most Affordable Home Prices
Wealthy people know the best money secrets. Learn how to copy them.
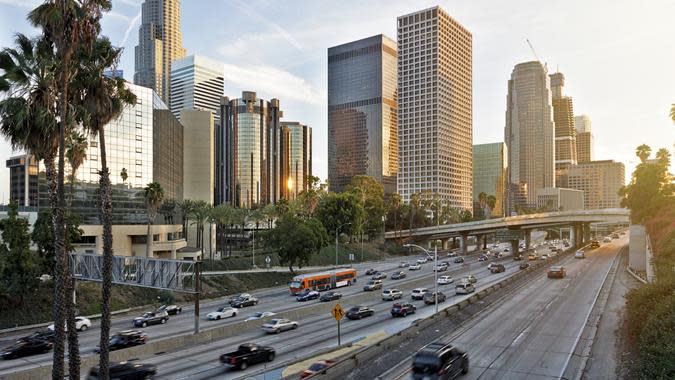
Los Angeles
Total population: 3,881,041
Median household income: $76,244
Average home value: $972,829
Average monthly mortgage payment: $5,760
Average monthly rent: $2,870
Homeowner monthly cost of living: $8,120
Renter monthly cost of living: $5,229
Check Out: If You Live in One of These 20 Housing Markets, Consider Selling While It’s Still Hot

Chicago
Total population: 2,721,914
Median household income: $71,673
Average home value: $302,992
Average monthly mortgage payment: $1,794
Average monthly rent: $2,200
Homeowner monthly cost of living: $3,957
Renter monthly cost of living: $4,362
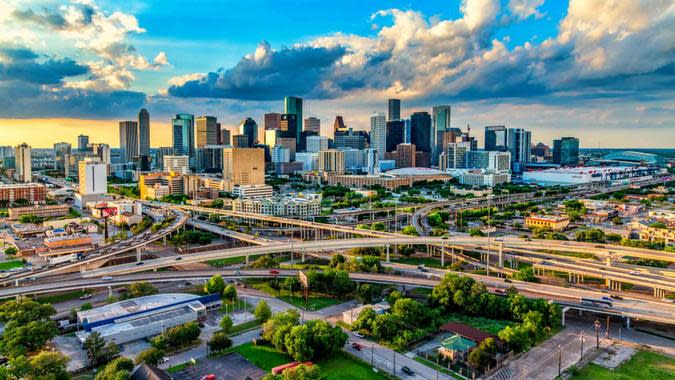
Houston
Total population: 2,296,253
Median household income: $60,440
Average home value: $272,144
Average monthly mortgage payment: $1,611
Average monthly rent: $1,646
Homeowner monthly cost of living: $3,686
Renter monthly cost of living: $3,720

Phoenix
Total population: 1,609,456
Median household income: $72,092
Average home value: $431,906
Average monthly mortgage payment: $2,557
Average monthly rent: $1,739
Homeowner monthly cost of living: $4,629
Renter monthly cost of living: $3,810
Try This: 3 Best Florida Cities To Buy Property in the Next 5 Years, According To Real Estate Agents

Philadelphia
Total population: 1,593,208
Median household income: $57,537
Average home value: $226,995
Average monthly mortgage payment: $1,344
Average monthly rent: $1,810
Homeowner monthly cost of living: $3,652
Renter monthly cost of living: $4,118

San Antonio
Total population: 1,445,662
Median household income: $59,593
Average home value: $262,088
Average monthly mortgage payment: $1,552
Average monthly rent: $1,455
Homeowner monthly cost of living: $3,476
Renter monthly cost of living: $3,378

San Diego
Total population: 1,383,987
Median household income: $98,657
Average home value: $1,031,493
Average monthly mortgage payment: $6,108
Average monthly rent: $3,116
Homeowner monthly cost of living: $8,279
Renter monthly cost of living: $5,287
Explore More: 20 Best Cities Where You Can Buy a House for Under $100K

Dallas
Total population: 1,300,642
Median household income: $63,985
Average home value: $318,682
Average monthly mortgage payment: $1,887
Average monthly rent: $1,760
Homeowner monthly cost of living: $3,985
Renter monthly cost of living: $3,858
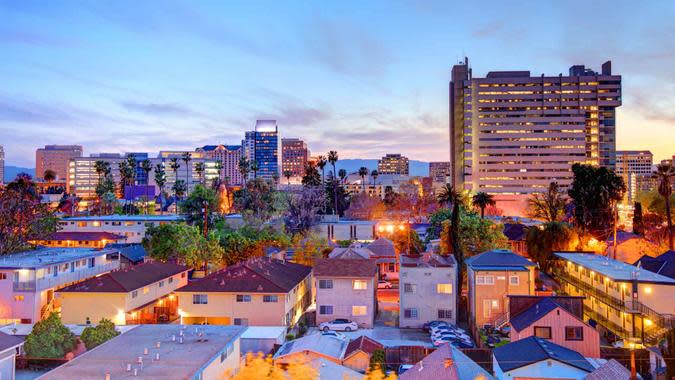
San Jose, California
Total population: 1,001,176
Median household income: $136,010
Average home value: $1,472,661
Average monthly mortgage payment: $8,720
Average monthly rent: $3,243
Homeowner monthly cost of living: $11,159
Renter monthly cost of living: $5,682
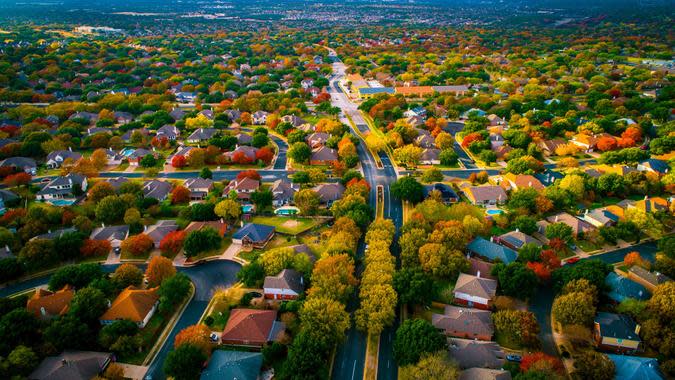
Austin, Texas
Total population: 958,202
Median household income: $86,556
Average home value: $544,638
Average monthly mortgage payment: $3,225
Average monthly rent: $1,791
Homeowner monthly cost of living: $5,281
Renter monthly cost of living: $3,848
Be Aware: 5 Worst California Cities To Buy Property Over the Next 5 Years, per Real Estate Agents
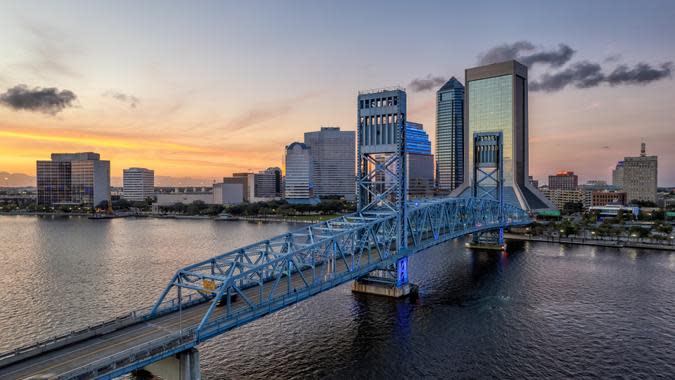
Jacksonville, Florida
Total population: 950,203
Median household income: $64,138
Average home value: $302,349
Average monthly mortgage payment: $1,790
Average monthly rent: $1,645
Homeowner monthly cost of living: $3,815
Renter monthly cost of living: $3,669
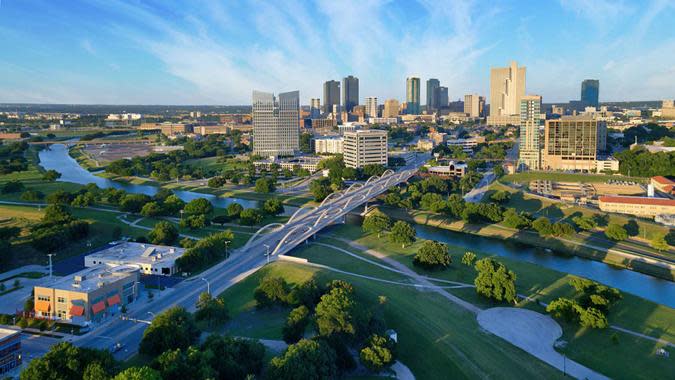
Fort Worth, Texas
Total population: 924,663
Median household income: $72,726
Average home value: $309,932
Average monthly mortgage payment: $1,835
Average monthly rent: $1,735
Homeowner monthly cost of living: $3,916
Renter monthly cost of living: $3,816
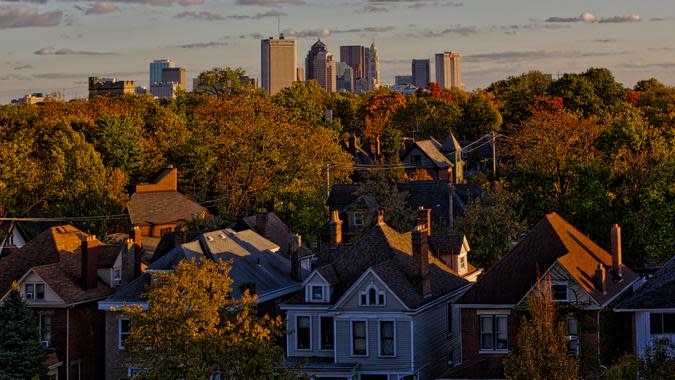
Columbus, Ohio
Total population: 902,449
Median household income: $62,994
Average home value: $247,042
Average monthly mortgage payment: $1,463
Average monthly rent: $1,483
Homeowner monthly cost of living: $3,368
Renter monthly cost of living: $3,389
Try This: 7 Types of Homes Expected To Soar in Value by the End of 2025
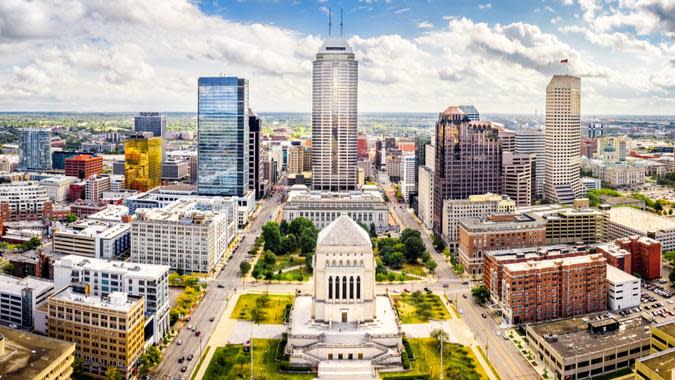
Indianapolis
Total population: 882,006
Median household income: $59,110
Average home value: $232,695
Average monthly mortgage payment: $1,378
Average monthly rent: $1,454
Homeowner monthly cost of living: $3,266
Renter monthly cost of living: $3,343
Methodology: GOBankingRates found the average cost of living for homeowners and renters in the USA’s largest 100 cities by population. First, GOBankingRates found the top 100 cities by population as sourced from the U.S. Census American Community Survey. For each city, several factors were found, including total population, total households and household median income all sourced from the U.S. Census American Community Survey. The cost of living indexes was sourced from Sperling’s BestPlaces, and the national average expenditure costs for all residents were used, as sourced from the Bureau of Labor Statistics Consumer Expenditure Survey for all residents. The single-family home value was sourced from the Zillow Home Value Index and by assuming a 10% down payment and using the national average 30-year fixed mortgage rate as sourced from the Federal Reserve Economic Data, the average mortgage rate can be calculated. The average rental cost was sourced from the Zillow Observed Rental Index for each city. The average rent cost and average mortgage cost can be used with the average expenditure cost to calculate the total cost of living for renters and homeowners. The cities were ranked to show the cheapest to most expensive cities and then sorted by total population to show the cost of living for homeowners and renters in the top 100 cities by population. All data was collected on and is up to date as of July 15, 2024.
More From GOBankingRates
This article originally appeared on GOBankingRates.com: The Cost Difference Between Renting and Buying in America’s Largest Cities