
 Yahoo Finance
 Commodity Technical Analysis: Overlapping Rallies Leave Crude Vulnerable
Daily Candles
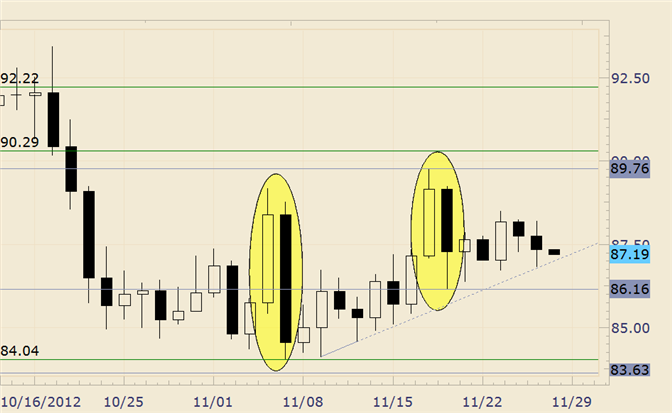
Chart Prepared by Jamie Saettele, CMT
Commodity Analysis: Crude has traded between mostly 85 and 89 for over a month now but trading on 11/6-11/7 and 11/19-20 suggest that the break will be lower. Strong advances were immediately retraced, suggesting weak longs and indicating increased selling pressure. The overlapping of rallies (look at intraday chart) suggests that strength is corrective as well.
Commodity Trading Strategy: Nothing for now.
LEVELS: 8404 8500 8616 8850 8976 9029
DailyFX provides forex news and technical analysis on the trends that influence the global currency markets.
Learn forex trading with a free practice account and trading charts from FXCM.
