
 Yahoo Finance
 Commodity Technical Analysis: Gold Breaks Through Trendline Resistance
Daily Bars
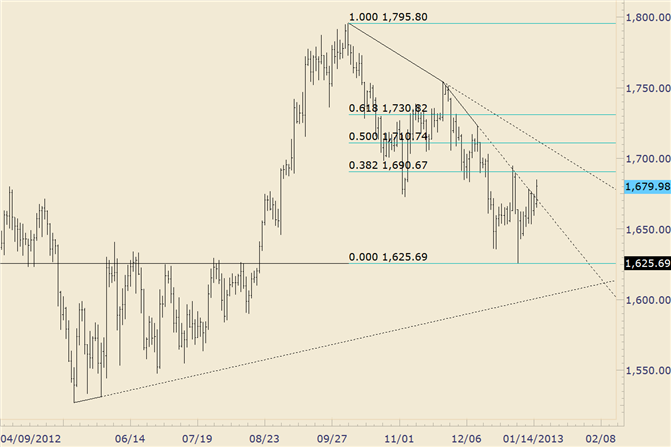
Chart Prepared by Jamie Saettele, CMT
Commodity Analysis: Gold’s response at the 61.8% retracement of the rally from the 2011 low (lowest level of the move from the record high) and former resistance (top of congestion from June to August 2012) is impressive. The break above trendline resistance that extends off of the November and December highs shifts immediate focus to the 1/2 high and trendline that extends off of the October and November highs.
Commodity Trading Strategy: Flat
LEVELS: 1626 1642 1653 1679 1695 1703
DailyFX provides forex news and technical analysis on the trends that influence the global currency markets.
Learn forex trading with a free practice account and trading charts from FXCM.
