Advertisement
Singapore markets closed
  • Straits Times Index

    3,176.51
    -11.15 (-0.35%)
     
  • Nikkei

    37,068.35
    -1,011.35 (-2.66%)
     
  • Hang Seng

    16,224.14
    -161.73 (-0.99%)
     
  • FTSE 100

    7,895.85
    +18.80 (+0.24%)
     
  • Bitcoin USD

    63,710.72
    -1,529.53 (-2.34%)
     
  • CMC Crypto 200

    1,371.97
    +59.35 (+4.52%)
     
  • S&P 500

    4,967.23
    -43.89 (-0.88%)
     
  • Dow

    37,986.40
    +211.02 (+0.56%)
     
  • Nasdaq

    15,282.01
    -319.49 (-2.05%)
     
  • Gold

    2,406.70
    +8.70 (+0.36%)
     
  • Crude Oil

    83.24
    +0.51 (+0.62%)
     
  • 10-Yr Bond

    4.6150
    -0.0320 (-0.69%)
     
  • FTSE Bursa Malaysia

    1,547.57
    +2.81 (+0.18%)
     
  • Jakarta Composite Index

    7,087.32
    -79.50 (-1.11%)
     
  • PSE Index

    6,443.00
    -80.19 (-1.23%)
     

Commodity Technical Analysis: Crude Trendline Break Targets 9900

Daily Bars

eliottWaves_oil_body_crude.png, Commodity Technical Analysis: Crude Trendline Break Targets 9900

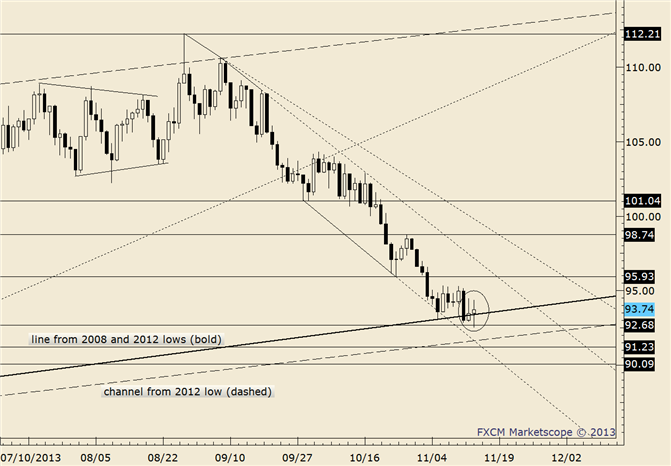
Chart Prepared by Jamie Saettele, CMT

Commodity Analysis: Crude closed the week above a nearly 11 month trendline (extends off of the 2012 highs) on Friday. Immediate focus shifts to the September high at 10040 although there is likely resistance at 99. It’s worth noting the daily RSI is above 70. Since the 2009 low, RSI has been unable to stay above 70 for longer than a few days.

Commodity Trading Strategy: Flat

LEVELS: 9380 9515 9620 9900 10040 10175

DailyFX provides forex news and technical analysis on the trends that influence the global currency markets.
Learn forex trading with a free practice account and trading charts from FXCM.