
 Yahoo Finance
 Commodities Technical Analysis, November 20th – November 24th, 2017
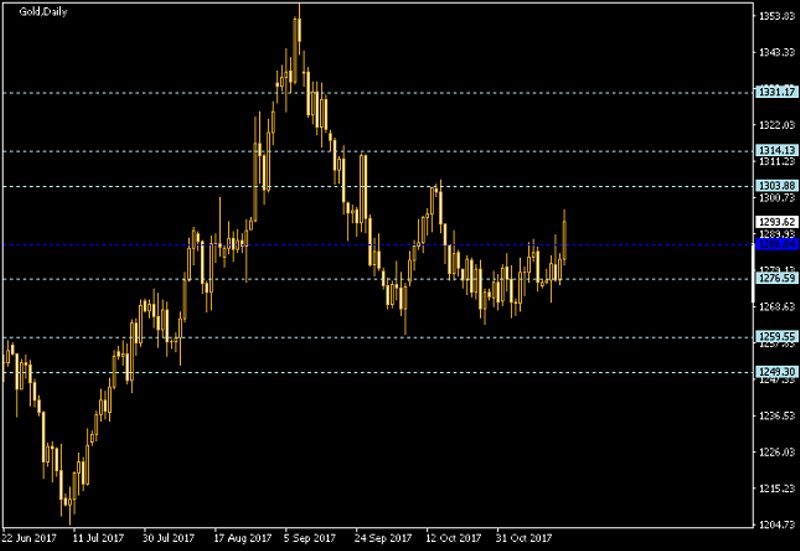
Gold finished the previous week higher as uncertainty over the tax reform add risk to the markets and weighed on the US dollar. Gold futures settled at $1296.50, up +1.43%.
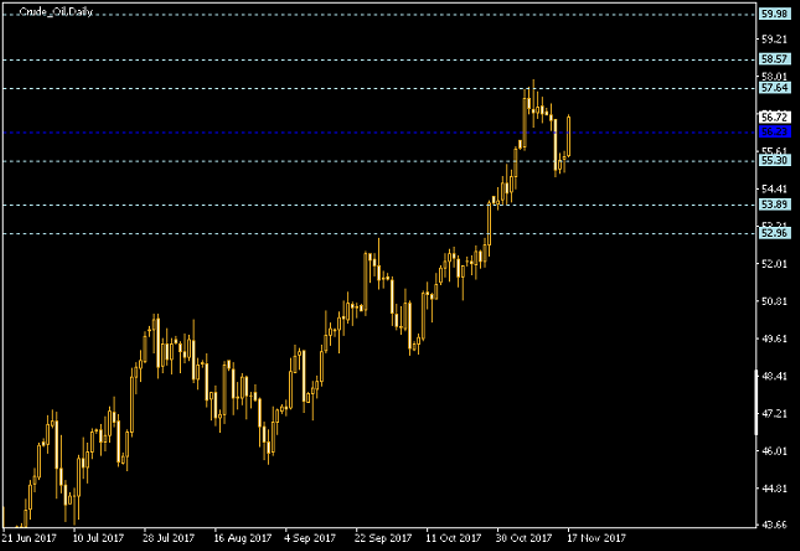
WTI crude oil closed the higher on Friday, however, crude oil prices posted their first weekly loss in six weeks. WTI Crude Oil futures settled at $56.71, down -0.47%.
The technical analysis, that includes the indicators’ data and major pivot points for WTI Oil, Gold, Silver and Copper as traded on spot market as of November 19th, 2017:
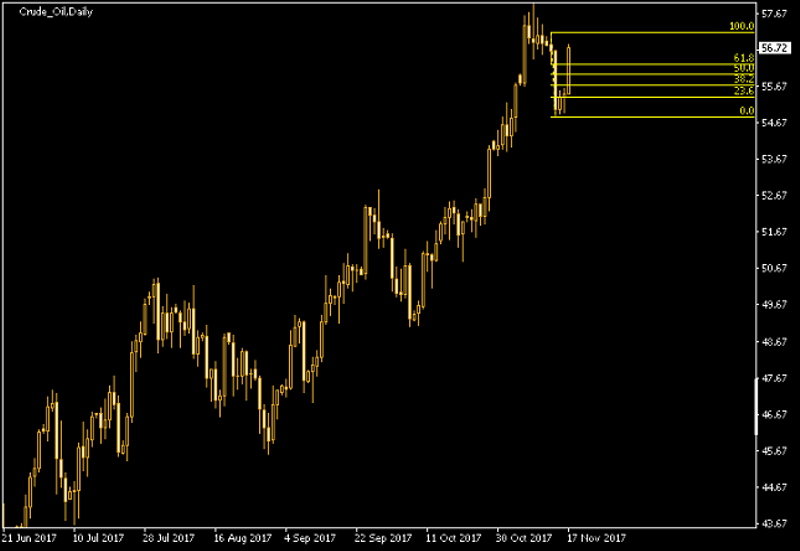
Crude Oil
Indicators
Moving Averages | RSI | Parabolic SAR | CCI |
Long | Neutral | Short | Neutral |

Floor Pivot Points
3rd Sup | 2nd Sup | 1st Sup | Pivot | 1st Res | 2nd Res | 3rd Res |
52.96 | 53.89 | 55.30 | 56.23 | 57.64 | 58.57 | 59.98 |
Fibonacci Retracement Levels
0.0% | 23.6% | 38.2% | 50.0% | 61.8% | 100.0% |
54.81 | 55.36 | 55.70 | 55.98 | 56.26 | 57.15 |
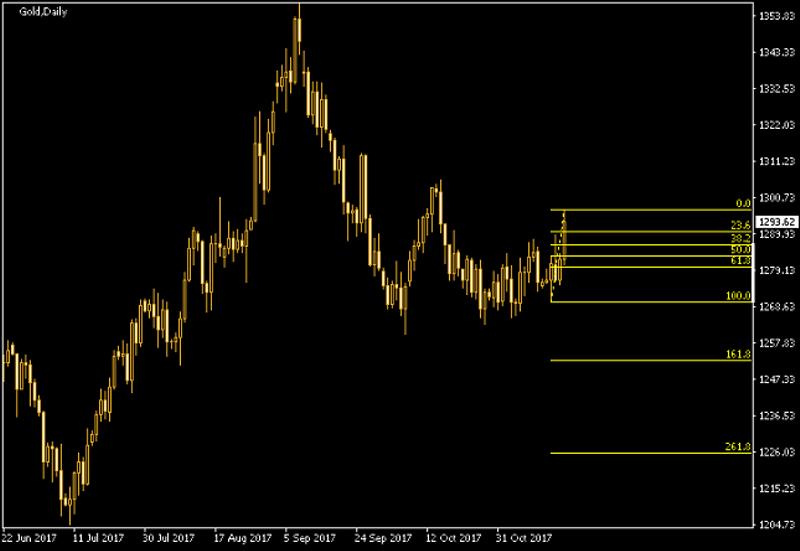
Gold
Indicators
Moving Averages | RSI | Parabolic SAR | CCI |
Short | Neutral | Long | Long |

Floor Pivot Points
3rd Sup | 2nd Sup | 1st Sup | Pivot | 1st Res | 2nd Res | 3rd Res |
1249.30 | 1259.55 | 1276.59 | 1286.84 | 1303.88 | 1314.13 | 1331.17 |
Fibonacci Retracement Levels
0.0% | 23.6% | 38.2% | 50.0% | 61.8% | 100.0% |
1269.81 | 1276.25 | 1280.23 | 1283.46 | 1286.68 | 1297.10 |
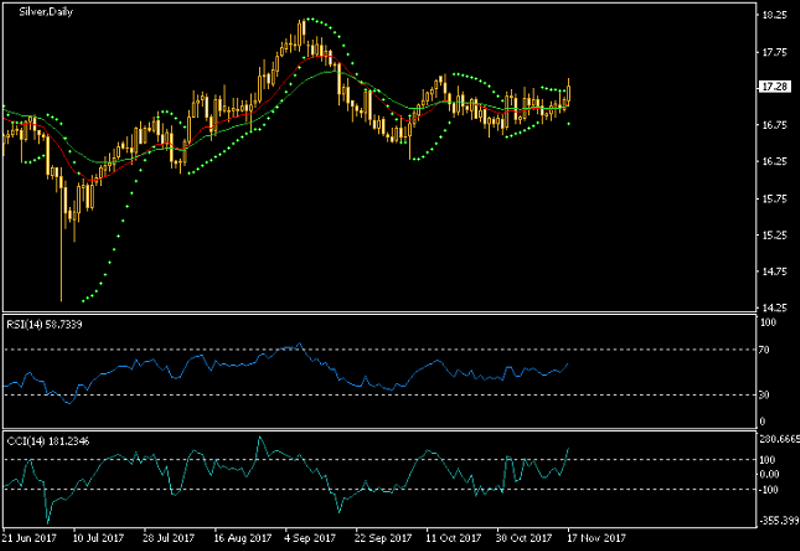
Silver
Indicators
Moving Averages | RSI | Parabolic SAR | CCI |
Neutral | Neutral | Long | Long |
Floor Pivot Points
3rd Sup | 2nd Sup | 1st Sup | Pivot | 1st Res | 2nd Res | 3rd Res |
16.36 | 16.59 | 16.93 | 17.16 | 17.50 | 17.73 | 18.07 |
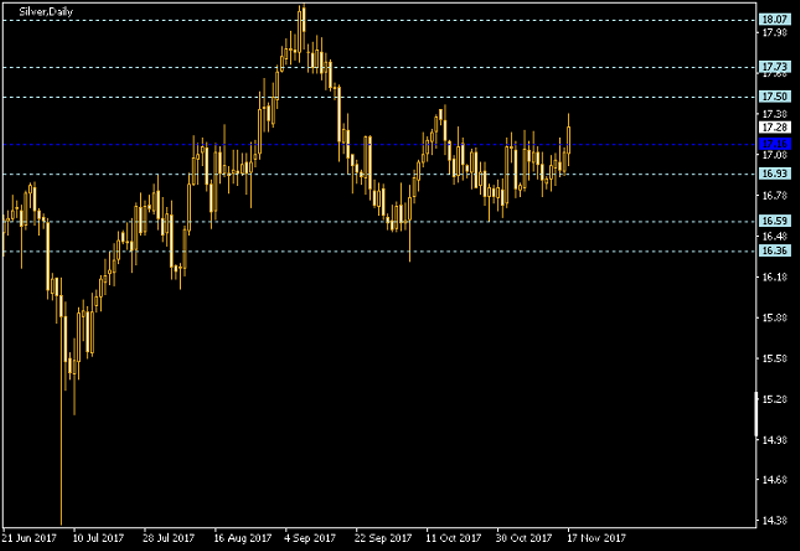
Fibonacci Retracement Levels
0.0% | 23.6% | 38.2% | 50.0% | 61.8% | 100.0% |
16.81 | 16.94 | 17.03 | 17.10 | 17.16 | 17.38 |

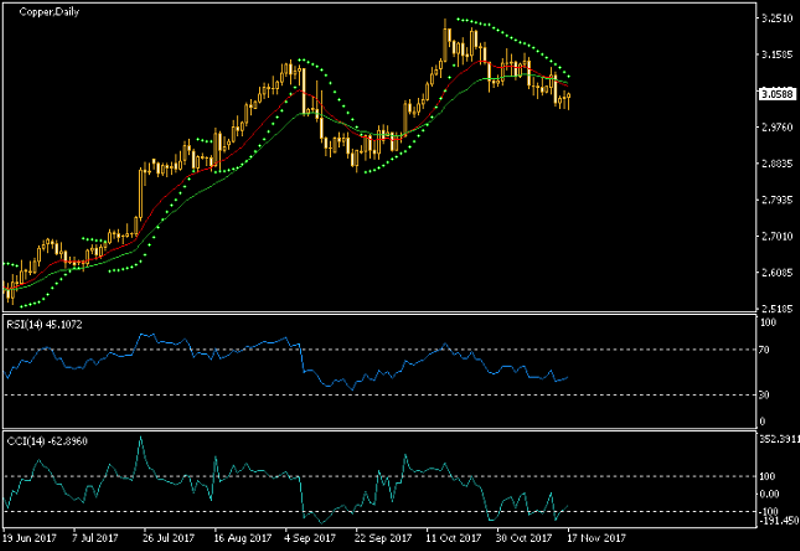
Copper
Indicators
Moving Averages | RSI | Parabolic SAR | CCI |
Short | Neutral | Short | Neutral |
Floor Pivot Points
3rd Sup | 2nd Sup | 1st Sup | Pivot | 1st Res | 2nd Res | 3rd Res |
290.71 | 296.45 | 301.16 | 306.90 | 311.61 | 317.35 | 322.06 |

Fibonacci Retracement Levels
0.0% | 23.6% | 38.2% | 50.0% | 61.8% | 100.0% |
302.18 | 304.65 | 306.17 | 307.41 | 308.64 | 312.63 |

This post was originally published by EarnForex
This article was originally posted on FX Empire
