
 Yahoo Finance
 Commodities: Crude Oil, Gold at Risk as S&P 500 Setup Hints at Weakness
Crude oil and gold prices may decline as S&P 500 positioning warns of risk aversion ahead that sinks growth-linked assets and boosts the US Dollar.
Talking Points
Commodities Adrift as Risk Trends Weigh Euro FinMin Summit, US Data
Crude Oil, Copper Vulnerable as S&P 500 Chart Points to Risk Aversion
Gold and Silver to Decline if Risk-Off Mood to Boost US Dollar Demand
Yesterday’s Eurozone finance ministers’ summit on Greek bailout funding ended in disappointment, failing to stamp out skepticism of policymakers’ crisis management efforts. Meanwhile, October’s Durable Goods report registered better than economists expected. The gauge printed unchanged compared with expectations calling for a 0.7 percent decline. This has left commodities adrift as risk appetite trends look for a clear directional bearing. S&P 500 technical positioning warns of a pullback ahead however. Such a scenario – if it materializes – is likely to translate into weakness in sentiment-linked crude oil and copper prices, while gold and silver face de-facto selling pressure as haven flows buoy the US Dollar.
WTI Crude Oil (NY Close): $87.74 // -0.54 // -0.61%
Prices are consolidating below resistance at 89.48, the 23.6% Fibonacci expansion. Initial rising trend line support is at 87.22, with a break below that exposing the November 7 low at 84.04. Alternatively, a push above resistance targets the 38.2% level at 92.88.
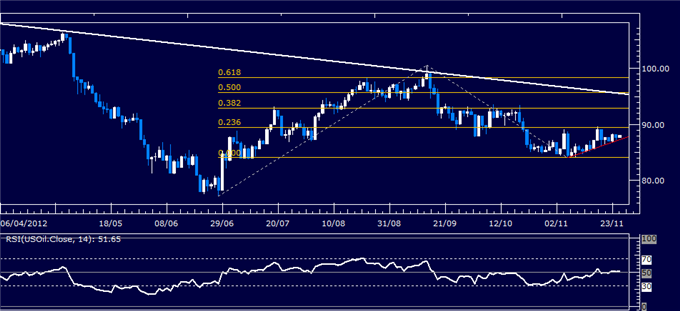
Daily Chart - Created Using FXCM Marketscope 2.0
Spot Gold (NY Close): $1748.65 // -4.35 // -0.25%
Prices appear to have carved out a bullish Inverse Head and Shoulders chart pattern confirmed with a close above neckline resistance at 1737.28, 23.6% Fibonacci retracement. The setup implies a measured upside target at 1802.06. The 1737.28 level has been recast as near-term support, with a break below that aiming for the 38.2% Fib at 1688.65.
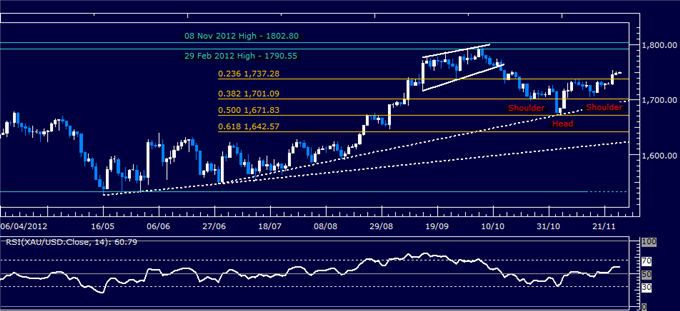
Daily Chart - Created Using FXCM Marketscope 2.0
Want to learn more about RSI? Watch this Video
Spot Silver (NY Close): $34.16 // +0.07 // +0.20%
Prices are testing resistance at 34.18, the 38.2% Fibonacci expansion. A break above that exposes the 50% level at 35.29. Near-term rising trend line support is at 33.12 and is reinforced by the 23.6% Fib at 32.84. A drop below the latter level aims for the November 5 low at 30.65.
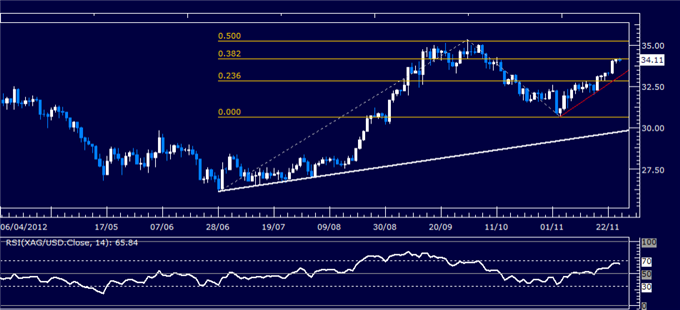
Daily Chart - Created Using FXCM Marketscope 2.0
Want to learn more about RSI? Watch this Video
COMEX E-Mini Copper (NY Close): $3.536 // +0.008 // +0.23%
Prices are consolidating below resistance at 3.540, the 38.2% Fibonacci retracement. Initial support lines up at 3.487, the 23.6% level, with a break below that aiming for rising trend line support at 3.412. Alternatively, push above 3.540 targets the 50% Fib at 3.588.
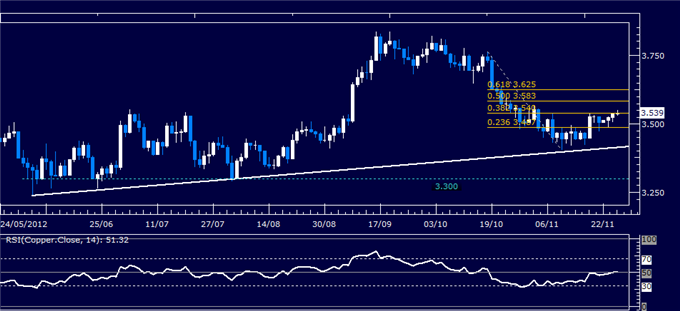
Daily Chart - Created Using FXCM Marketscope 2.0
--- Written by Ilya Spivak, Currency Strategist for Dailyfx.com
To contact Ilya, e-mail ispivak@dailyfx.com. Follow Ilya on Twitter at @IlyaSpivak
To be added to Ilya's e-mail distribution list, please CLICK HERE
DailyFX provides forex news and technical analysis on the trends that influence the global currency markets.
Learn forex trading with a free practice account and trading charts from FXCM.
