
 Yahoo Finance
 Comerica (CMA) Q2 Earnings Improve Y/Y, Revenues Increase

Comerica CMA reported adjusted earnings per share of $1.90 in second-quarter 2018, up from the year-ago adjusted figure of $1.15. Including certain non-recurring items, earnings came in at $1.87. The Zacks Consensus Estimate was $1.62.
Higher revenues, lower expenses and improved credit metrics were recorded. Moreover, rise in loans was another tailwind. However, lower deposits remained an undermining factor.
Adjusted net income came in at $332 million, up 60.4% year over year. This figure excludes a restructuring charge of $9 million and other non-recurring items.
Segment wise, on a year-over-year basis, net income increased 30% at Business Bank, 100% at Retail Bank and 4.3% at Wealth Management. Finance segment recorded net income against net loss in the prior-year quarter.
Revenues Up, Expenses Fall
Comerica’s second-quarter total revenues were $838 million, up 8% year over year. Also, the figure surpassed the Zacks Consensus Estimate of $831.9 million.
Net interest income increased 18% on a year-over-year basis to $590 million. Moreover, net interest margin expanded 59 basis points (bps) to 3.62%.
Total non-interest income came in at $248 million, down 10.1% on a year-over-year basis. Lower card fees, service charge on deposits and other non-interest income were partially offset by increased fiduciary and foreign exchange income.
Further, non-interest expenses totaled $448 million, down 2% year over year. The fall was chiefly due to lower outside processing fee expenses and other non-interest charges.
Solid Balance Sheet
As of Jun 30, 2018, total assets and common shareholders' equity were $72 billion and $8.1 billion, respectively, compared with $71.4 billion and $8 billion as of Jun 30, 2017.
Total loans inched up nearly 1% year over year to $49.8 billion. However, total deposits decreased about 1% from the prior-year quarter to $57.2 billion.
Credit Quality Improved
Total non-performing assets plunged 48% year over year to $264 million. Also, allowance for loan losses was $711 million, down 5.6% from the prior-year period. Additionally, the allowance for loan losses to total loans ratio was 1.36% as of Jun 30, 2018, down from 1.43% as of Jun 30, 2017.
Furthermore, Comerica reported net loan recoveries of $3 million against $18 million net charge-offs recorded in year-ago quarter. In addition, a benefit to provision for credit losses of $29 million was reported.
Strong Capital Position
As of Jun 30, 2018, the company's tangible common equity ratio was 10.42%, up 5 bps year over year. Common equity tier 1 capital ratio was 11.90%, up from 11.51% reported in the year-ago quarter. Total risk-based capital ratio was 13.96%, up from 13.66% in the prior-year quarter.
Capital Deployment Update
Comerica’s capital-deployment initiatives highlight the company’s capital strength. During the reported quarter, Comerica repurchased 1.8 million shares under its existing equity repurchase program. This, combined with dividends, resulted in a total payout of $227 million to shareholders.
Impressive Outlook for 2H18
Comerica guided for second half of 2018, taking into consideration the current economic and rate environment, along with the GEAR Up initiative.
The company anticipates higher net interest income, including the benefit of short-term rate increase and loan growth. Notably, full-year benefits from first two quarters of 2018 rate increases of $105-$110 million are expected.
Non-interest income is estimated to be higher resulting from GEAR Up opportunities driving growth in treasury management and card fees, along with fiduciary income.
Non-interest expenses are predicted to increase modestly, excluding restructuring expenses. Notably, GEAR Up savings are expected to remain on track.
Restructuring charges of $20-$25 million is anticipated. Persistent higher technology expenditures and typical inflationary pressures are likely to occur.
Provision for credit losses is likely to be $10-$20 million per quarter and net charge-offs are expected to be low.
Income tax expenses are anticipated to approximate 23% of pre-tax income, excluding further tax impact from employee stock transactions.
Comerica expects average loan growth to be modest. The outlook reflects rise across most lines of business, and stability in energy and corporate banking portfolios.
Our Viewpoint
Consistent improvement in the loan portfolio is projected to offset the pressure on revenues to some extent. Further, the company will benefit from its ongoing strategic initiatives. Its robust capital position supports steady capital-deployment activities through share repurchases and dividend hikes, which seem impressive. Moreover, decline in expenses and rising rates remained tailwinds.
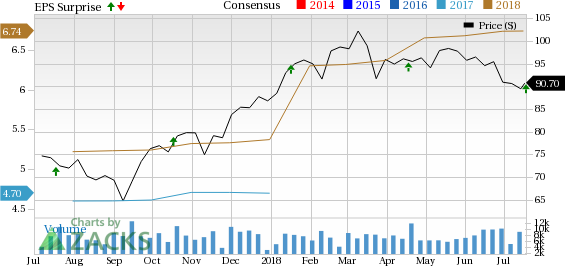
Comerica Incorporated Price, Consensus and EPS Surprise
Comerica Incorporated Price, Consensus and EPS Surprise | Comerica Incorporated Quote
Currently, Comerica carries a Zacks Rank #3 (Hold). You can see the complete list of today’s Zacks #1 Rank (Strong Buy) stocks here.
Performance of Other Wall Street Biggies
Higher-than-expected trading revenues and rise in demand for loans drove JPMorgan’s JPM second-quarter 2018 earnings of $2.29 per share, which outpaced the Zacks Consensus Estimate of $2.22. The figure was up 26% from the prior-year quarter.
Driven by top-line strength, Citigroup C delivered a positive earnings surprise of 5.2% in second-quarter 2018. Earnings from continuing operations per share of $1.62 for the quarter easily outpaced the Zacks Consensus Estimate of $1.54. Also, earnings were up 28% year over year.
Impacted by lower mortgage banking revenues, Wells Fargo WFC recorded a negative earnings surprise of 3.6% in second-quarter 2018. Adjusted earnings of $1.08 per share missed the Zacks Consensus Estimate of $1.12. Results were in line with the prior-year quarter earnings.
Today's Stocks from Zacks' Hottest Strategies
It's hard to believe, even for us at Zacks. But while the market gained +21.9% in 2017, our top stock-picking screens have returned +115.0%, +109.3%, +104.9%, +98.6%, and +67.1%.
And this outperformance has not just been a recent phenomenon. Over the years it has been remarkably consistent. From 2000 - 2017, the composite yearly average gain for these strategies has beaten the market more than 19X over. Maybe even more remarkable is the fact that we're willing to share their latest stocks with you without cost or obligation.
See Them Free>>
Want the latest recommendations from Zacks Investment Research? Today, you can download 7 Best Stocks for the Next 30 Days. Click to get this free report
JPMorgan Chase & Co. (JPM) : Free Stock Analysis Report
Comerica Incorporated (CMA) : Free Stock Analysis Report
Wells Fargo & Company (WFC) : Free Stock Analysis Report
Citigroup Inc. (C) : Free Stock Analysis Report
To read this article on Zacks.com click here.
