
 Yahoo Finance
 CNO Financial's (CNO) Q4 Earnings Beat Estimates, Surge Y/Y
CNO Financial Group, Inc.’s CNO fourth-quarter 2019 adjusted earnings per share of 47 cents beat the Zacks Consensus Estimate of 43 cents by 9.3%. The bottom line also improved 30.6% year over year, mainly on the back of solid revenues.
In the quarter under review, CNO Financial’s total revenues surged 37.4% year over year to $1069 million owing to policyholder and other special-purpose portfolios, higher fee revenues and other income plus other net realized investment gains.
Quarterly Operational Update
Total collected premiums of $972.8 million slipped 1.5% from the prior-year quarter, mainly due to weak contribution from Bankers Life segment.
New annualized premiums for life and health products amounted to $97.6 million, up 8.9% from the year-ago period.
First-year collected premiums declined 6.1% from the year-earlier quarter.
CNO Financial Group, Inc. Price, Consensus and EPS Surprise
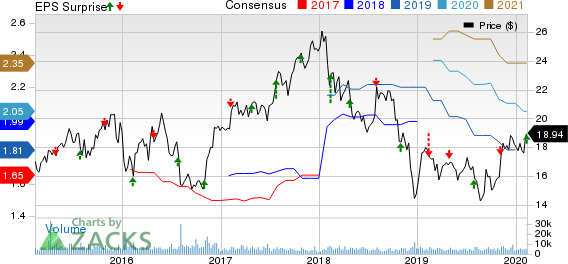
CNO Financial Group, Inc. price-consensus-eps-surprise-chart | CNO Financial Group, Inc. Quote
Quarterly Segment Update
Bankers Life
Total collected premiums of $711.1 million were down 2.9% year over year.
New annualized premiums for life and health products dipped 0.5% year over year.
Washington National
Total collected premiums of $181.2 million inched up 2.8% year over year.
New Annualized premiums from life and health products were $39.7 million, up 31.9% from the year-ago figure.
Colonial Penn
Total collected premiums were $77.3 million, up 2.8% year over year.
New annualized premiums from life and health products were $15.9 million, down 8.1% from the amount recorded in the comparable quarter last year.
Long-Term Care in Run-Off
Total collected premiums were $3.2 million, down 13.5% year over year.
The long-term care business was ceded under a 100% indemnity coinsurance agreement in the third quarter of 2018.
Financial Update
Unrestricted cash and cash equivalents held by CNO Financial’s holding company were $580 million as of Dec 31, 2019, down 2.4% from the level at 2018 end.
Debt-to-capital ratio was 17.5% as of Dec 31, 2019 compared with 21.4% at 2018 end.
Securities Repurchase and Divided Update
In the fourth quarter of 2019, the company returned $91 million in the form of share repurchases and dividend.
Full-Year Update
For 2019, net income came in at $409.4 million against a net loss of $315 million in 2018.
In 2019, the company returned $319 million to its shareholders in the form of share repurchases and dividends.
Zacks Rank and Performance of Other Insurers
CNO Financial carries a Zacks Rank #3 (Hold). Among other players from the insurance industry, which already reported fourth-quarter earnings, the bottom-line results of Brown & Brown, Inc. BRO and RLI Corp. RLI beat estimates while that of Principal Financial PFG matched the same. You can see the complete list of today’s Zacks #1 Rank (Strong Buy) stocks here.
Today's Best Stocks from Zacks
Would you like to see the updated picks from our best market-beating strategies? From 2017 through 2019, while the S&P 500 gained and impressive +53.6%, five of our strategies returned +65.8%, +97.1%, +118.0%, +175.7% and even +186.7%.
This outperformance has not just been a recent phenomenon. From 2000 – 2019, while the S&P averaged +6.0% per year, our top strategies averaged up to +54.7% per year.
See their latest picks free >>
Want the latest recommendations from Zacks Investment Research? Today, you can download 7 Best Stocks for the Next 30 Days. Click to get this free report
RLI Corp. (RLI) : Free Stock Analysis Report
CNO Financial Group, Inc. (CNO) : Free Stock Analysis Report
Principal Financial Group, Inc. (PFG) : Free Stock Analysis Report
Brown & Brown, Inc. (BRO) : Free Stock Analysis Report
To read this article on Zacks.com click here.
Zacks Investment Research
