
 Yahoo Finance
 Civil Service Bonus And How It Affects You
The civil service has an estimated workforce of close to 150,000 people or around 4% of the country’s labour force as of end 2015. And this group of people had something to cheer about when the Public Service Division announced on, 25 November 2016, a year-end Annual Variable Component (AVC) of 0.5 month. Adding this to the mid-year bonus of 0.45 month and the Annual Wage Supplement (or 13th month), all civil servants will get a bonus of 1.95 month for 2016.
For the rest of the non-civil service group, should we be interested in knowing about the total bonus for the civil servants? How can we make sense of this data to better understand our economy? We aim to find out by comparing the civil service bonus to 1) GDP Growth Rate 2) CPI and 3) STI.
Before we dive into the three charts, let’s clear some issues on the make-up of the civil service bonus. We have excluded the 13th month bonus (AWS), as PSD has consistently paid out regardless of the economic situation, as experienced in 2009 when no mid-year bonus was announced but the civil servants were paid their AWS. We have also excluded any special cash payouts given for that year.
1. GDP Growth Rate VS Civil Service Bonus
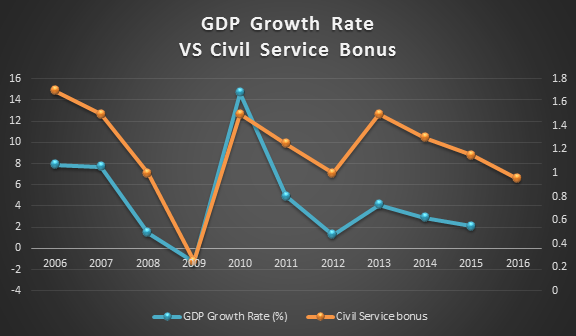
Coefficient Correlation = 0.731196
(1 = indicates it’s perfect positive correlated to another other. And -1 = indicates perfect negative correlation)
The trend of Civil Service Bonus has been declining for the past 3 years after reaching a high of 1.5 -month bonus in 2013. This is in-line with the GDP growth rate which reached a plateau in 2010 at 14.7%, and has since seen a steady weakness.
The civil service bonus and the GDP growth rate has a coefficient score of 0.73. This shows that it has a high positive correlation and affirms the fact that the civil service bonus is pegged to the GDP.
Given the pace of decline in the civil service bonus this year, we predict the GDP for 2016 to come in at around 1.5 – 1.9%.
2. CPI VS Civil Service Bonus

Coefficient Correlation = -0.01217
(1 = indicates it’s perfect positive correlated to another other. And -1 = indicates perfect negative correlation)
The Consumer Price Index (CPI) has seen a steep decline for the past 4 years. One might have enjoyed the benefits of a lower inflation through the reduced public transport fares, electric tariffs and the recently announced lower property tax for 2016. However, one of the only exceptions to the low public goods has been the increase of waste removal fees.
The civil service bonus has a coefficient score of -0.01 to the CPI. Since this number is close to 0, it shows that the two do not have any linear relationships. The civil service bonus as expected is not affected by the CPI and one should look at their yearly increment to determine if one is keeping up with the inflation rate.
MAS and MTI said they expect core inflation to average 1% this year, before rising to 1 to 2 % next year, driven by energy-related costs.
3. Straits Times Index VS Civil Service Bonus

Coefficient Correlation = 0.327954
(1 = indicates it’s perfect positive correlated to another other. And -1 = indicates perfect negative correlation)
Finally, we compare the year-end prices of the benchmark Straits Times Index (STI) to the civil service bonus. The STI has been ranging in the 2500 – 3500 band for the past 7 years. This is a telling tale for investors to invest in their financial education to be better stock pickers.
The civil service bonus has a coefficient score of 0.33 to the STI. This shows that it has a mild positive correlation. However, looking from the charts, the civil service bonus has been a laggard compared to the STI. Nonetheless, could investors be wise to take note of the high/low civil bonus as an indicator for market top/bottom? – this requires more research and testing to be seen as a valid indicator, but one worth monitoring.
DBS Vickers has a year-end target for the STI of 2850. It expects the STI to continue to trade within the 2800 to 2900 band in December.
Want to receive first-hand information about new announcements and events from us? Or simply looking for more exclusive content that are not available on our website? Subscribe to our free e-newsletter to get insider access to activities, articles and promotions. We will only send you stuff that we too would be interested to know. Follow us on Instagram @DNSsingapore and Facebook @DollarsAndSenseSG to get your daily dose of finance inspirations through photos and articles.
The post Civil Service Bonus And How It Affects You appeared first on DollarsAndSense.sg.