
 Yahoo Finance
 Cincinnati Financial's (CINF) Q4 Earnings Top, Rise Y/Y
Cincinnati Financial Corporation CINF reported fourth-quarter 2019 operating income of $1.23 per share, beating the Zacks Consensus Estimate by 10.8%. Also, the bottom line improved 25.5% year over year on the back of higher revenues.
Operational Update
Total operating revenues in the quarter under review were $1.6 billion, up 8.8% year over year. This improvement was driven by 9% higher premiums earned and a 4% rise in investment income.
Net written premiums increased 11% from the prior-year quarter, reflecting price increases and premium growth initiatives.
Total benefits and expenses of Cincinnati Financial increased 6.2% year over year to $1.4 billion, primarily due to higher insurance loss and contract holders’ benefits plus underwriting, acquisition and insurance expenses.
Combined ratio — a measure of underwriting profitability — improved 230 basis points (bps) year over year to 91.6%.
Cincinnati Financial Corporation Price, Consensus and EPS Surprise
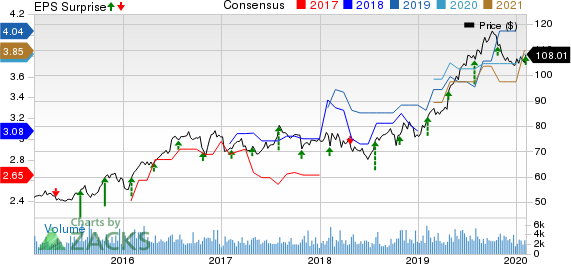
Cincinnati Financial Corporation price-consensus-eps-surprise-chart | Cincinnati Financial Corporation Quote
Quarterly Segment Update
Commercial Lines Insurance: Total revenues of $854 million grew 5% year over year. This upside was primarily boosted by solid premiums earned. Underwriting profit of $97 million surged 76.4% year over year as well. The combined ratio also contracted 460 bps year over year to 88.8%.
Personal Lines Insurance: Total revenues of $359 million rose 5% year over year owing to 5% increase in premiums earned. The segment generated underwriting profit of $4 million, plunging 87% year over year. The combined ratio expanded 760 bps year over year to 99.3%.
Excess and Surplus Lines Insurance: Total revenues of $76 million climbed 25% year over year, aided by 25% higher earned premiums. However, the segment’s underwriting profit of $13 million dropped 13% year over year.
Moreover, the combined ratio expanded 750 bps year over year to 82.9%.
Life Insurance: Total revenues were $106 million, up 6% year over year.
Full-Year Update
For the full year, total operating income came in at $4.20 per share, up 25% year over year. Total revenues for the year resulted in $7.9 billion, up 47% year over year.
Financial Update
As of Dec 31, 2019, cash and invested assets were $20.5 billion, up 17% from the 2018-end level.
Total assets of $25.4 billion increased 15.8% from the figure at 2018 end.
Total debt amounted to $827 million, up 0.9% from the number at 2018 end.
Cincinnati Financial’s debt-to-capital ratio was 7.7% as of Dec 31, 2019, contracting 180 bps from the number at 2018 end.
As of Dec 31, 2019, its book value per share was at $60.55, up 26% from the figure at 2018 end.
Zacks Rank
Cincinnati Financial currently carries a Zacks Rank #3 (Hold). You can see the complete list of today’s Zacks #1 Rank (Strong Buy) stocks here.
Performance of Other Insurers
Among other players from the insurance industry having already reported fourth-quarter earnings, the bottom-line results of Brown & Brown, Inc. BRO and RLI Corp. RLI beat estimates while that of Principal Financial PFG met the mark.
More Stock News: This Is Bigger than the iPhone!
It could become the mother of all technological revolutions. Apple sold a mere 1 billion iPhones in 10 years but a new breakthrough is expected to generate more than 27 billion devices in just 3 years, creating a $1.7 trillion market.
Zacks has just released a Special Report that spotlights this fast-emerging phenomenon and 6 tickers for taking advantage of it. If you don't buy now, you may kick yourself in 2020.
Click here for the 6 trades >>
Want the latest recommendations from Zacks Investment Research? Today, you can download 7 Best Stocks for the Next 30 Days. Click to get this free report
Brown & Brown, Inc. (BRO) : Free Stock Analysis Report
Principal Financial Group, Inc. (PFG) : Free Stock Analysis Report
Cincinnati Financial Corporation (CINF) : Free Stock Analysis Report
RLI Corp. (RLI) : Free Stock Analysis Report
To read this article on Zacks.com click here.
Zacks Investment Research
