
 Yahoo Finance
 Ciena (CIEN) Q4 Earnings Miss Estimates, Revenues Rise Y/Y
Ciena Corporation CIEN reported mixed fourth-quarter fiscal 2019 (ended Oct 31, 2019) results, wherein the top line surpassed the Zacks Consensus Estimate but the bottom line missed the same. Market share gains on the back of technology leadership and diversified customer base in high-growth markets aided results.
Net Income
On a GAAP basis, net income for the quarter was $80.3 million or 51 cents per share compared with $64 million or 34 cents per share in the year-ago quarter. The year-over-year improvement was primarily driven by top-line growth. For fiscal 2019, net income was $253.4 million or $1.61 per share against net loss of $344.7 million or loss of $2.49 per share in fiscal 2018.
Quarterly adjusted net income came in at $90.4 million or 58 cents per share compared with $81 million or 53 cents per share in the prior-year quarter. The bottom line, however, missed the Zacks Consensus Estimate by 5 cents.
Ciena Corporation Price, Consensus and EPS Surprise
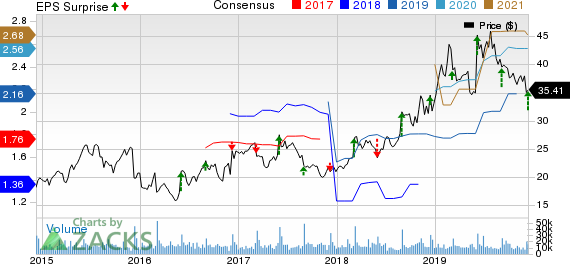
Ciena Corporation price-consensus-eps-surprise-chart | Ciena Corporation Quote
Revenues
Quarterly total revenues increased 7.6% year over year to $968 million on the back of higher product sales. Ciena had one 10%-plus customers for the quarter, which represented 15.1% of revenues. The top line surpassed the consensus estimate of $965 million.
Region wise, revenues from North America were $672.7 million, up 21.1% year over year, driven by additional share gains across diverse customer base, including new wins and increasing traction of packet and software portfolios. Revenues from Europe, Middle East and Africa were $153 million, up 24.3%. Caribbean and Latin America totaled $43 million, down 18.9%. Asia Pacific revenues were $99.3 million, down 40.9%.
For fiscal 2019, revenues increased 15.4% year over year to $3,572.1 million. Ciena had three 10%-plus customers for the fiscal year, which represented 34.1% of revenues.
Quarterly Segment Results
Revenues from Networking Platforms increased 11.9% year over year to $797.7 million. Platform Software and Services revenues were $41.2 million compared with $56.6 million in the prior-year quarter. Blue Planet Automation Software and Services revenues grew from $10.7 million to $16.6 million. Revenues from Global Services were $112.5 million compared with $119.2 million a year ago.
Other Details
Gross margin was 43.4% compared with 44.3% in the year-ago quarter. Operating expenses were $326.5 million, up from $302.2 million. Operating income decreased to $93.2 million from $95.9 million. Operating margin was 9.6% compared with 10.7% in the prior-year quarter. Adjusted EBITDA was $151.6 million, up from $145.8 million.
During the reported quarter, Ciena repurchased nearly 1 million shares for an aggregate price of $38.2 million.
Cash Flow & Liquidity
During fiscal 2019, Ciena generated $413.1 million of net cash from operating activities compared with $229.3 million in fiscal 2018. As of Oct 31, 2019, the company had $904 million in cash and equivalents with $680.4 million of net long-term debt compared with the respective tallies of $745.4 million and $686.5 million a year ago.
Zacks Rank & Stocks to Consider
Ciena currently has a Zacks Rank #3 (Hold).
Some better-ranked stocks in the broader industry are Qualcomm Incorporated QCOM, Ubiquiti Inc. UI and PCTEL, Inc. PCTI. While Qualcomm and Ubiquiti sport a Zacks Rank #1 (Strong Buy), PCTEL carries a Zacks Rank #2 (Buy). You can see the complete list of today’s Zacks #1 Rank stocks here.
Qualcomm has long-term earnings growth expectation of 14%.
Ubiquiti has long-term earnings growth expectation of 9.4%.
PCTEL surpassed earnings estimates in each of the trailing four quarters, the average surprise being 150.6%.
Looking for Stocks with Skyrocketing Upside?
Zacks has just released a Special Report on the booming investment opportunities of legal marijuana.
Ignited by new referendums and legislation, this industry is expected to blast from an already robust $6.7 billion to $20.2 billion in 2021. Early investors stand to make a killing, but you have to be ready to act and know just where to look.
See the pot trades we're targeting>>
Want the latest recommendations from Zacks Investment Research? Today, you can download 7 Best Stocks for the Next 30 Days. Click to get this free report
QUALCOMM Incorporated (QCOM) : Free Stock Analysis Report
PCTEL, Inc. (PCTI) : Free Stock Analysis Report
Ciena Corporation (CIEN) : Free Stock Analysis Report
Ubiquiti Inc. (UI) : Free Stock Analysis Report
To read this article on Zacks.com click here.
Zacks Investment Research
