Calculating The Fair Value Of Mako Mining Corp. (CVE:MKO)
Key Insights
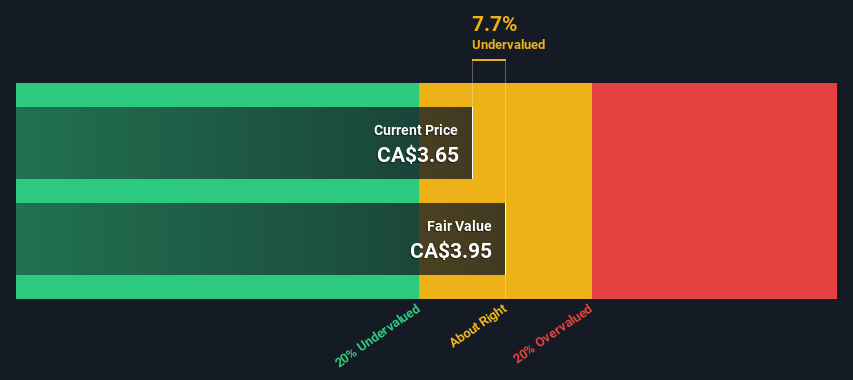
Mako Mining's estimated fair value is CA$3.95 based on 2 Stage Free Cash Flow to Equity
With CA$3.65 share price, Mako Mining appears to be trading close to its estimated fair value
The average premium for Mako Mining's competitorsis currently 244%
In this article we are going to estimate the intrinsic value of Mako Mining Corp. (CVE:MKO) by estimating the company's future cash flows and discounting them to their present value. We will take advantage of the Discounted Cash Flow (DCF) model for this purpose. Don't get put off by the jargon, the math behind it is actually quite straightforward.
We generally believe that a company's value is the present value of all of the cash it will generate in the future. However, a DCF is just one valuation metric among many, and it is not without flaws. If you want to learn more about discounted cash flow, the rationale behind this calculation can be read in detail in the Simply Wall St analysis model.
Check out our latest analysis for Mako Mining
The Calculation
We're using the 2-stage growth model, which simply means we take in account two stages of company's growth. In the initial period the company may have a higher growth rate and the second stage is usually assumed to have a stable growth rate. To begin with, we have to get estimates of the next ten years of cash flows. Seeing as no analyst estimates of free cash flow are available to us, we have extrapolate the previous free cash flow (FCF) from the company's last reported value. We assume companies with shrinking free cash flow will slow their rate of shrinkage, and that companies with growing free cash flow will see their growth rate slow, over this period. We do this to reflect that growth tends to slow more in the early years than it does in later years.
A DCF is all about the idea that a dollar in the future is less valuable than a dollar today, and so the sum of these future cash flows is then discounted to today's value:
10-year free cash flow (FCF) forecast
2025 | 2026 | 2027 | 2028 | 2029 | 2030 | 2031 | 2032 | 2033 | 2034 | |
Levered FCF ($, Millions) | US$10.6m | US$11.2m | US$11.7m | US$12.2m | US$12.6m | US$12.9m | US$13.3m | US$13.6m | US$13.9m | US$14.3m |
Growth Rate Estimate Source | Est @ 7.29% | Est @ 5.72% | Est @ 4.63% | Est @ 3.87% | Est @ 3.33% | Est @ 2.96% | Est @ 2.69% | Est @ 2.51% | Est @ 2.38% | Est @ 2.29% |
Present Value ($, Millions) Discounted @ 7.2% | US$9.9 | US$9.7 | US$9.5 | US$9.2 | US$8.9 | US$8.5 | US$8.1 | US$7.8 | US$7.4 | US$7.1 |
("Est" = FCF growth rate estimated by Simply Wall St)
Present Value of 10-year Cash Flow (PVCF) = US$86m
After calculating the present value of future cash flows in the initial 10-year period, we need to calculate the Terminal Value, which accounts for all future cash flows beyond the first stage. For a number of reasons a very conservative growth rate is used that cannot exceed that of a country's GDP growth. In this case we have used the 5-year average of the 10-year government bond yield (2.1%) to estimate future growth. In the same way as with the 10-year 'growth' period, we discount future cash flows to today's value, using a cost of equity of 7.2%.
Terminal Value (TV)= FCF2034 × (1 + g) ÷ (r – g) = US$14m× (1 + 2.1%) ÷ (7.2%– 2.1%) = US$282m
Present Value of Terminal Value (PVTV)= TV / (1 + r)10= US$282m÷ ( 1 + 7.2%)10= US$140m
The total value, or equity value, is then the sum of the present value of the future cash flows, which in this case is US$226m. In the final step we divide the equity value by the number of shares outstanding. Relative to the current share price of CA$3.7, the company appears about fair value at a 7.7% discount to where the stock price trades currently. Valuations are imprecise instruments though, rather like a telescope - move a few degrees and end up in a different galaxy. Do keep this in mind.
Important Assumptions
The calculation above is very dependent on two assumptions. The first is the discount rate and the other is the cash flows. You don't have to agree with these inputs, I recommend redoing the calculations yourself and playing with them. The DCF also does not consider the possible cyclicality of an industry, or a company's future capital requirements, so it does not give a full picture of a company's potential performance. Given that we are looking at Mako Mining as potential shareholders, the cost of equity is used as the discount rate, rather than the cost of capital (or weighted average cost of capital, WACC) which accounts for debt. In this calculation we've used 7.2%, which is based on a levered beta of 1.122. Beta is a measure of a stock's volatility, compared to the market as a whole. We get our beta from the industry average beta of globally comparable companies, with an imposed limit between 0.8 and 2.0, which is a reasonable range for a stable business.
SWOT Analysis for Mako Mining
Strength
Debt is not viewed as a risk.
Weakness
Shareholders have been diluted in the past year.
Opportunity
Current share price is below our estimate of fair value.
Lack of analyst coverage makes it difficult to determine MKO's earnings prospects.
Threat
No apparent threats visible for MKO.
Moving On:
Valuation is only one side of the coin in terms of building your investment thesis, and it ideally won't be the sole piece of analysis you scrutinize for a company. DCF models are not the be-all and end-all of investment valuation. Instead the best use for a DCF model is to test certain assumptions and theories to see if they would lead to the company being undervalued or overvalued. For example, changes in the company's cost of equity or the risk free rate can significantly impact the valuation. For Mako Mining, there are three essential items you should further research:
Risks: For example, we've discovered 1 warning sign for Mako Mining that you should be aware of before investing here.
Management:Have insiders been ramping up their shares to take advantage of the market's sentiment for MKO's future outlook? Check out our management and board analysis with insights on CEO compensation and governance factors.
Other High Quality Alternatives: Do you like a good all-rounder? Explore our interactive list of high quality stocks to get an idea of what else is out there you may be missing!
PS. Simply Wall St updates its DCF calculation for every Canadian stock every day, so if you want to find the intrinsic value of any other stock just search here.
Have feedback on this article? Concerned about the content? Get in touch with us directly. Alternatively, email editorial-team (at) simplywallst.com.
This article by Simply Wall St is general in nature. We provide commentary based on historical data and analyst forecasts only using an unbiased methodology and our articles are not intended to be financial advice. It does not constitute a recommendation to buy or sell any stock, and does not take account of your objectives, or your financial situation. We aim to bring you long-term focused analysis driven by fundamental data. Note that our analysis may not factor in the latest price-sensitive company announcements or qualitative material. Simply Wall St has no position in any stocks mentioned.
Have feedback on this article? Concerned about the content? Get in touch with us directly. Alternatively, email editorial-team@simplywallst.com