
 Yahoo Finance
 The CAC 40 Breaks to Weekly Highs
DailyFX.com -
Talking Points
CAC 40 Opens Up Higher, +2.75% on the Session
Bullish Breakouts for the CAC 40 Begin Above 4,204.50
If you are looking for more trading ideas for equities markets, check out our Trading Guides
The CAC 40 has broken higher this morning, and is trading up +2.75% on today’s session. Currently prices are trading above the R4 pivot at 4178.7, and have printed a new weekly high at 4,204.50. If prices continue to trade above today’s R4 Camarilla pivot, it opens the Index up to trade towards new higher highs. Bullish breakout targets for the CAC 40 may be found by extrapolating a 1X extension of today’s trading range. This places initial targets for the Index near 4,261.70.
CAC 40, 30 Minute Chart with Pivots
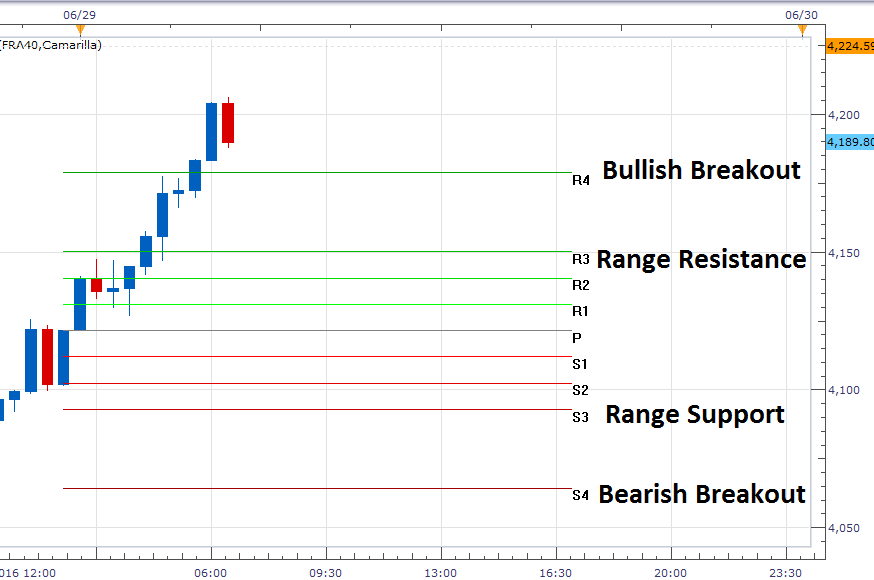
(Created using Marketscope 2.0 Charts)
In the event of a bearish reversal, traders may look for price action to first break back below the R4 pivot mentioned above. Next traders should look for the CAC 40 to trade back inside of today’s pivot range. This range begins at the R3 pivot at 4,150.10. A move to this value would be significant, as it would suggest that earlier bullish market conditions have concluded. Point at which traders may begin looking for the Index to trade towards values of support. This includes the S3 pivot at 4,092.90, and the S4 pivot at 4,064.30.

Find out real time sentiment data with the DailyFX’s sentiment page.
Sentiment for the CAC 40 (Ticker: FRA40) remains positive with SSI (speculative sentiment index) reading at +1.68. With 63% of positioning long, this may suggest that the CAC 40 may continue to trade lower. In the event of a price decline, traders should look for SSI to move to a positive extreme of +2.0 or greater. Alternatively, if prices continue to trade higher, traders should look for SSI to move towards values that are more neutral.
To Receive Walkers’ analysis directly via email, please SIGN UP HERE
See Walker’s most recent articles at his Bio Page.
Contact and Follow Walker on Twitter @WEnglandFX.
DailyFX provides forex news and technical analysis on the trends that influence the global currency markets.
Learn forex trading with a free practice account and trading charts from FXCM.