
 Yahoo Finance
 Bukit Sembawang Estates Limited (SGX:B61): Does The Earnings Decline Make It An Underperformer?

When Bukit Sembawang Estates Limited (SGX:B61) released its most recent earnings update (31 March 2018), I compared it against two factor: its historical earnings track record, and the performance of its industry peers on average. Being able to interpret how well Bukit Sembawang Estates has done so far requires weighing its performance against a benchmark, rather than looking at a standalone number at a point in time. In this article, I’ve summarized the key takeaways on how I see B61 has performed. See our latest analysis for Bukit Sembawang Estates
Was B61’s recent earnings decline indicative of a tough track record?
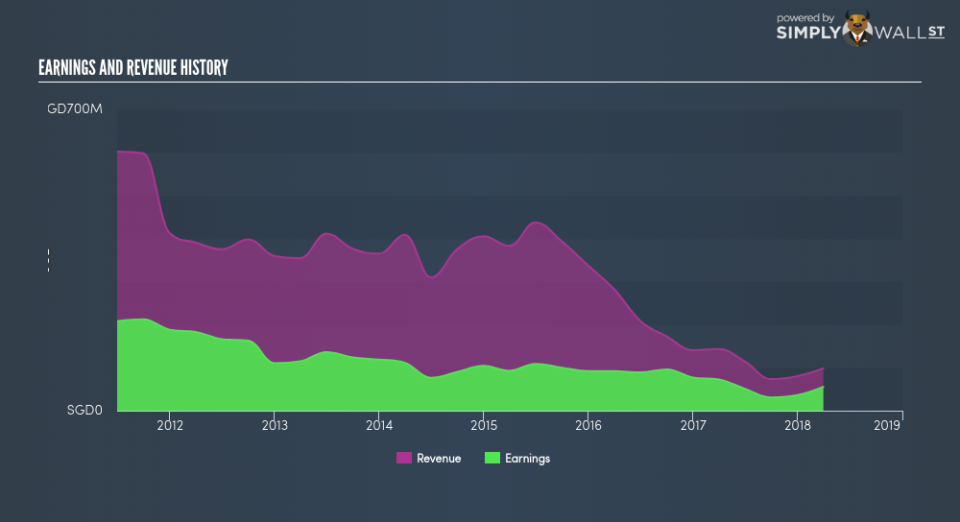
B61’s trailing twelve-month earnings (from 31 March 2018) of S$55.31m has declined by -23.66% compared to the previous year. Furthermore, this one-year growth rate has been lower than its average earnings growth rate over the past 5 years of -19.33%, indicating the rate at which B61 is growing has slowed down. What could be happening here? Well, let’s take a look at what’s occurring with margins and whether the rest of the industry is facing the same headwind.
Although revenue growth over the past few years, has been negative, earnings growth has been declining by even more, meaning Bukit Sembawang Estates has been ramping up its expenses. This harms margins and earnings, and is not a sustainable practice. Viewing growth from a sector-level, the SG real estate industry has been growing, albeit, at a unexciting single-digit rate of 2.36% in the past year, . This is a change from a volatile drop of -2.65% in the previous couple of years. This suggests that any headwind the industry is facing, it’s hitting Bukit Sembawang Estates harder than its peers.
In terms of returns from investment, Bukit Sembawang Estates has not invested its equity funds well, leading to a 4.44% return on equity (ROE), below the sensible minimum of 20%. However, its return on assets (ROA) of 3.96% exceeds the SG Real Estate industry of 3.67%, indicating Bukit Sembawang Estates has used its assets more efficiently. Though, its return on capital (ROC), which also accounts for Bukit Sembawang Estates’s debt level, has declined over the past 3 years from 8.47% to 5.24%.
What does this mean?
Though Bukit Sembawang Estates’s past data is helpful, it is only one aspect of my investment thesis. In some cases, companies that experience an extended period of diminishing earnings are undergoing some sort of reinvestment phase Although, if the whole industry is struggling to grow over time, it may be a sign of a structural shift, which makes Bukit Sembawang Estates and its peers a higher risk investment. I suggest you continue to research Bukit Sembawang Estates to get a more holistic view of the stock by looking at:
Future Outlook: What are well-informed industry analysts predicting for B61’s future growth? Take a look at our free research report of analyst consensus for B61’s outlook.
Financial Health: Is B61’s operations financially sustainable? Balance sheets can be hard to analyze, which is why we’ve done it for you. Check out our financial health checks here.
Other High-Performing Stocks: Are there other stocks that provide better prospects with proven track records? Explore our free list of these great stocks here.
NB: Figures in this article are calculated using data from the trailing twelve months from 31 March 2018. This may not be consistent with full year annual report figures.
To help readers see pass the short term volatility of the financial market, we aim to bring you a long-term focused research analysis purely driven by fundamental data. Note that our analysis does not factor in the latest price sensitive company announcements.
The author is an independent contributor and at the time of publication had no position in the stocks mentioned.
