
 Yahoo Finance
 BTG/USD, DASH USD, and XMR USD Price forecast for the week of January 29, 2018, Technical Analysis
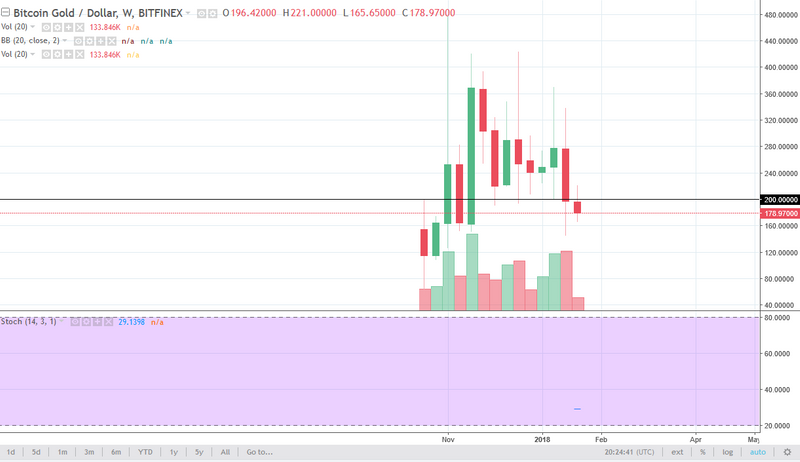
BTG/USD
Bitcoin Gold initially tried to rally during the week but found the area above $200 to be too much for buyers to overcome. We have broken down towards the $175 level, as the market looks very likely to continue to drop from here, reaching down towards the $150 level. Volume is dropping though, and that’s a very negative sign and I think that we will continue to see sellers in this market, as most people are willing to take their losses, or for a very fortunate few: take profits.
BTG/USD DASH USD and XMR USD Video 29.01.18
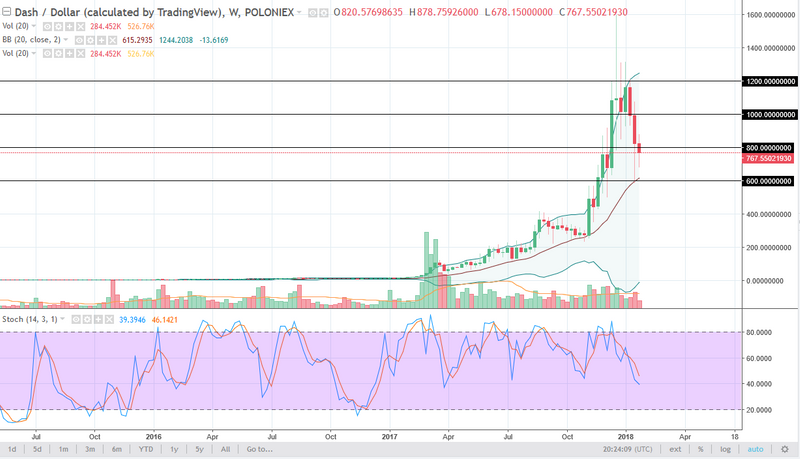
Dash/USD
Dash traders sold off during the week, breaking below the $800 level, but we did see a bit of a reprieve towards the end of the week, forming a hammer. The hammer of course is a bullish sign, but we have a lack of volume. Having said that, there is more volume in the dash market, relatively speaking, then there is in many of the other crypto currencies. I suppose if I were to start buying crypto currencies now, this might be the place I start looking. $600 underneath should be supportive, but a break above the top of the candle could be a sign to start going long again.
XMR/USD
Monero has broken down towards the $300 level during the week and found a little bit of support underneath. Volume is very light though, so I don’t like the idea of buying Monero right now, but if volume picks up I might be convinced to start buying again.
Buy & Sell Cryptocurrency Instantly

This article was originally posted on FX Empire
More From FXEMPIRE:
GBP/JPY Price forecast for the week of January 29, 2018, Technical Analysis
USD/JPY Price forecast for the week of January 29, 2018, Technical Analysis
FTSE 100 Price forecast for the week of January 29, 2018, Technical Analysis
Dow Jones 30 and NASDAQ 100 Price forecast for the week of January 29, 2018, Technical Analysis
S&P 500 Price forecast for the week of January 29, 2018, Technical Analysis
