
 Yahoo Finance
 Bitcoin (BTC) at Sub-$30,000 Remains a Warning for Crypto Dip Buyers
Key Insights:
Bitcoin (BTC) eyes the prospect of two consecutive daily gains after a tumble to sub-$26,000 levels.
The TerraUSD (UST) de-pegging and Terra LUNA meltdown have left the crypto market exposed to the threat of a major regulatory overhaul.
Bitcoin (BTC) technical indicators flash red, with bitcoin sitting well below the 50-day EMA.
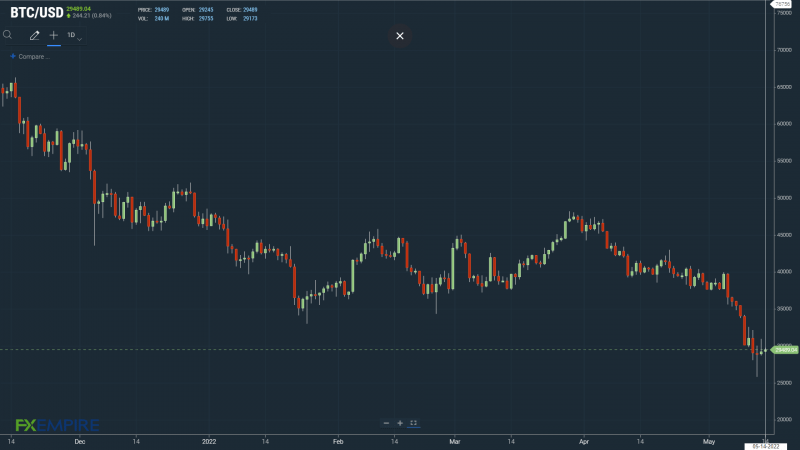
Bitcoin (BTC) rose by 1.14% on Friday, is investors moved on from the TerraUSD (UST) meltdown. Reversing a 0.35% decline from Thursday, bitcoin ended the day at $29,245.
Investor sentiment improved throughout the day as crypto investors responded to Tether’s (USDT) recovery from $0.95 levels.
Market angst over the TerraUSD (UST) dollar peg unraveling left the markets in disarray on Thursday.
USDT moved back to $0.99 levels, however, calming investor sentiment and fears of another stablecoin calamity.
Bitcoin Under Pressure as Fear & Greed Index Falls to Sub-10
This morning, the Fear & Greed Index slipped from 10/100 to 9/100, the lowest level since 8/100 on March 14, 2020.

For bitcoin investors, the decline to sub-10/100 is a warning, with several key drivers in play.
These key drivers include investor sentiment towards the US economic outlook and Fed monetary policy.
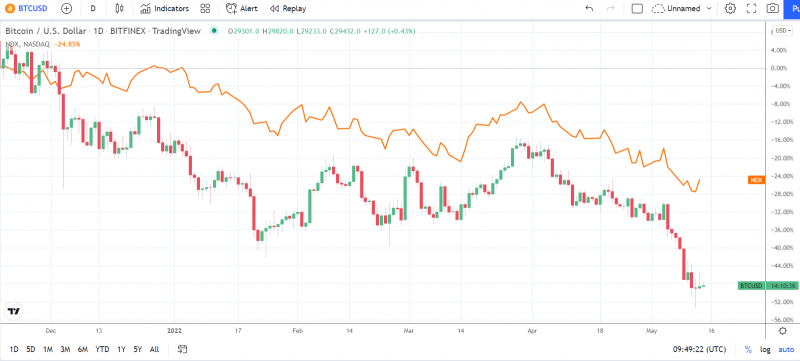
Barring the impact of the TerraUSD (UST) de-pegging and Terra LUNA implosion on the crypto market, bitcoin correlation with the NASDAQ 100 had undeniably strengthened.
Bitcoin (BTC) Price Action
At the time of writing, BTC was up 0.84% to $29,489.
A range-bound morning saw BTC rise to an early high of $29,755 before falling to a low of $29,173.
Technical Indicators
BTC will need to avoid the $29,634 pivot to target the First Major Resistance Level at $30,578 and resistance at $31,500.
BTC would need the broader crypto market to support a return to $30,000.
An extended rally would test the Second Major Resistance Level at $31,904 and resistance at $32,000. The Third Major Resistance Level sits at $34,164.
A fall through the pivot would test the First Major Support Level at $28,308. Barring another extended sell-off, BTC should steer clear of sub-$28,000 levels. The Second Major Support Level sits at $27,374.
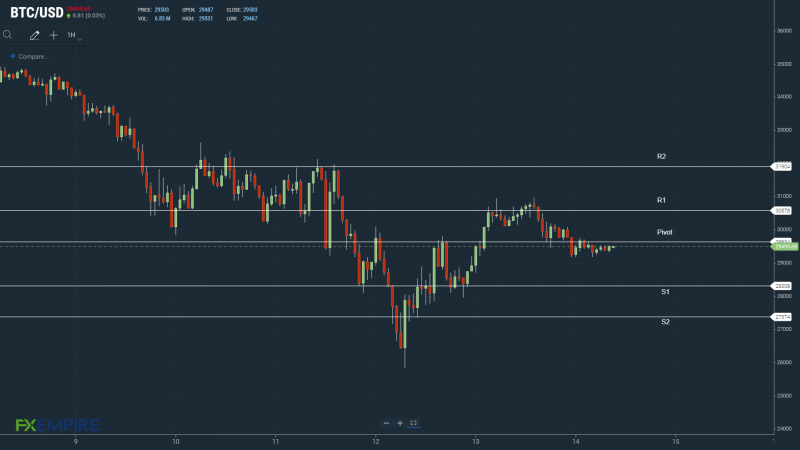
Looking at the EMAs and the 4-hourly candlestick chart (below), it is a bearish signal. BTC sits below the 50-day EMA, currently at $31,908. This morning, the 50-day pulled back from the 100-day EMA. The 100-day EMA fell back from the 200-day EMA; BTC negative.
A move through the 50-day EMA would support a run at $35,000.

This article was originally posted on FX Empire
More From FXEMPIRE:
Chadian police fire tear gas to disperse anti-French protest
Nigeria’s markets regulator publishes rules on crypto assets
Taliban’s first annual Afghan budget foresees $501 million deficit
Lavrov says all will suffer from West’s ‘total hybrid war’ on Russia
Hungary’s new president condemns Putin’s ‘aggression’, plans trip to Warsaw
Palestinians welcome foreign support in inquiry into reporter’s death
