
 Yahoo Finance
 The Best Value Stocks to Buy Today
Grasping the basic notion of value investing is relatively simple because most of us probably already practice the theory behind it as part of our regular shopping regimen. Imagine the place where you shop the most often, whether at a local grocery or hardware store, and you spot an item that is priced far less than it is actually worth. It doesn't matter if you're picturing organic kale or a lithium-ion battery-powered power drill, if you buy a product because it is priced below what you think it's worth, you get the theory behind value investing.
Before we get to the picks for some of the best value stocks on the market today, we're going to discuss all the fancy words and academic concepts behind value investing, but don't forget that, at its core, this is what it is: Investing in stocks that are priced below their real value.

Value investing is like bargain hunting in that it's looking to buy stocks that are on sale. Image source: Getty Images.
The efficient market hypothesis
The efficient market hypothesis states that the prices of publicly traded assets, like stocks, reflect all known information on the assets. While there are different variations on the theory about whether stock prices also reflect insider information, the main thrust is that, because all known information is already taken into account with stock prices, it is impossible for investors to "beat the market" through careful or expert stock selection. The theory essentially implies that when investors beat the market, it is more the result of chance than any inherent skill or careful analysis.
Why value investors reject the efficient market hypothesis
Value investors vehemently reject the idea of efficient markets. For starters, the historic presence of bubbles and crashes suggest that equities are often priced incorrectly. To take one historical example, on October 19, 1987, the Dow Jones Industrial Average lost 508 points in a single trading session -- approximately 23% of its value. Was the market fairly priced at the beginning of that day or the end? Are we expected to believe that information came out during the day that caused the market to lose almost a quarter of its value? That's to say nothing of other crashes like the tech bubble at the turn of the century and the financial crisis of 2008.
The father of value investing, Benjamin Graham, famously stated that the market goes through many moods and swings between overvaluing and undervaluing assets like stocks. In his seminal work, The Intelligent Investor, Graham writes:
Imagine that in some private business you own a small share that cost you $1,000. One of your partners, named Mr. Market, is very obliging indeed. Every day he tells you what he thinks your interest is worth and furthermore offers either to buy you out or to sell you an additional interest on that basis. Sometimes his idea of value appears plausible and justified by business developments and prospects as you know them. Often, on the other hand, Mr. Market lets his enthusiasm or his fears run away with him, and the value he proposes seems to you a little short of silly.
Margin of safety
The crux of value investing is that the intrinsic value of an asset exists outside of its market price. Applied to investing in stocks, this means there is a real value to the shares of the business not directly tied to its current price. This value is ascertained through a fundamental analysis of the security. When the market price is below the intrinsic value, this difference is often referred to as the margin of safety. The greater the margin of safety, the less chance there is that an investor will lose money on an investment. This illustration, by Motley Fool contributor Daniel Sparks, shows this concept perfectly:
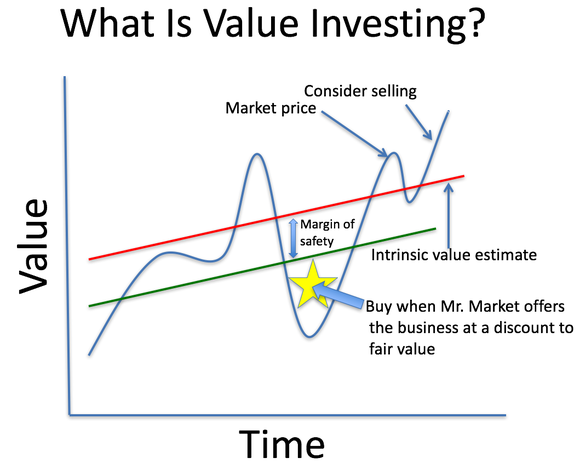
The greater the margin of safety present before buying a stock, the less chance an investor has of losing money on their investment. Chart by Daniel Sparks. Used with permission.
Different metrics used for value investing
Different value investors look at different metrics when evaluating a stock. One of the most common types of value investing is looking for stocks with a low price-to-earnings (P/E) ratio. This formula simply takes the stock's price and divides it by the company's trailing twelve months earnings per share (EPS). The lower the P/E ratio, the more earnings investors purchase with each share of a business.
Other value investors prefer to use the price-to-book ratio, commonly referred to as the P/B ratio. This formula is calculated by dividing the company's stock price by its book value per share. Book value is defined as total assets minus total liabilities. The lower the P/B ratio the more undervalued a stock is. If the ratio is less than one, this means the stock trades for less than its assets.
Still, other investors find value relative to the company's projected growth rate. For these investors, the most valuable metric to use is probably the PEG ratio or price-to-earnings-growth ratio. This metric compare's a company's P/E ratio to its expected earnings growth rate. Using this metric, a company with a low P/E might be more richly valued than another company with a slightly higher P/E ratio if the second company's EPS growth projections were higher.
Some value investors employ different methods for valuing stocks but I believe you will find these are the essential tools in the tool box for value investors.
Beware of value traps!
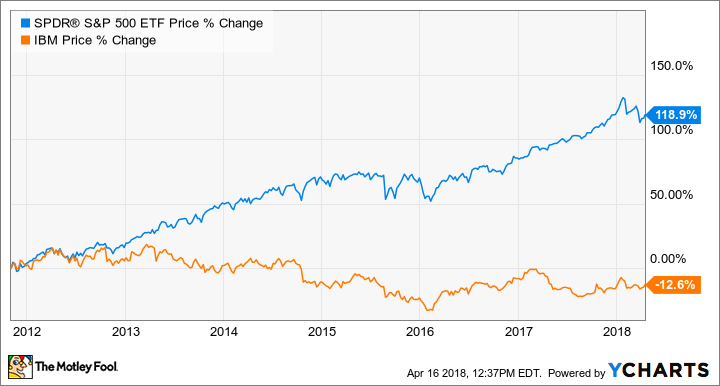
Value traps are stocks that appear to be cheap based on a traditional metric, such as a P/E ratio but, in reality, are not because of declining business prospects. Even the world's best investors, like Warren Buffett, have been known to fall for value traps. For instance, in 2011, Warren Buffett initiated a position in IBM (NYSE: IBM) that would soon grow into one of his largest, a $10 billion stake. At the time Buffett made his investment, IBM was guiding for $20 in EPS by 2015, which would have represented 74% growth from 2010's EPS of $11.52. IBM never came close to hitting this guidance, however, even with all the share repurchases money could buy.
Plagued by declining revenue, IBM's shares actually declined from the time Buffett bought most of his shares at the end of 2011 until the beginning of 2018, when he divested himself of most of the position. To rub salt into the wound, the S&P 500 index more than doubled during this time.
Other examples of common value traps include companies in cyclical industries or drug companies with expiring patents. This is why it is important to not only crunch a company's numbers before investing but to evaluate qualitative factors too. Sometimes a company looks cheap for a reason.
Top value stocks to buy today
Now that we've defined value investing, highlighted a few metrics that value investors look for, and warned investors to watch out for value traps, let's take a closer look at stocks that I believe are trading at prices below their intrinsic value today. While representing very different industries, the one thing that AFLAC Incorporated (NYSE: AFL), Skechers USA Inc (NYSE: SKX), and Verizon Communications Inc (NYSE: VZ) all have in common is that, based on each company's fundamentals, they appear to be some of the best bargains available in the stock market today.
Company name | Type of company | Market cap | P/E ratio |
|---|---|---|---|
AFLAC Incorporated | Insurance | $34.95 billion | 13.0 |
Skechers USA Inc | Footwear designer/retailer | $6.82 billion | 23.93 |
Verizon Communications | Telecommunications | $196.35 billion | 12.84 |
Data source: Aflac Incorporated, Skechers USA Inc, and Verizon Communications Inc. All P/E ratios calculated using adjusted earnings.
A quackin' good value
Aflac makes its money selling supplemental insurance policies for things like cancer and job-related injuries in the United States and Japan, where about two-thirds of its revenue is generated. The best insurers make more in premium revenue -- the money customers pay to be covered -- than they pay out in benefits. To determine Aflac's profitability, we must calculate its combined ratio. This formula is determined by taking the sum of the company's paid claims and general business expenses divided by the premium earnings.
Combined Ratio = (Losses + Expenses)/Earned Premiums
Anything over 1.0 shows a net loss during the time period and anything under 1.0 shows a net profit. To calculate Aflac's combined ratio, add the net of Aflac's "benefit and claims" with "total acquisition and operating expenses" for the numerator. The denominator can be found by adding the full year Aflac Japan and Aflac U.S. earned premiums from the company's 10-K. This gives us this equation:
12,181 + 5,468/18,315 = 0.964
This reveals Aflac makes a profit on its underwriting policies, not just from investing its float. Float is money temporarily available to insurance companies to invest in assets from the time customers pay their premiums to the time claims are paid out. In Aflac's case, the float is invested conservatively into fixed-income assets.
In January, a series of charges, ranging from fraud to allegations of harassment, were brought against the insurance company giving it a turbulent start to the year. The company vehemently denied the charges though, it might be a while before all concerns are ultimately dispelled. When the company reported its full 2017 fiscal year earnings, it received a huge windfall from the new tax legislation and, as a result, raised its dividend for the second consecutive quarter.
Based on the midpoint of its guidance for its operating earnings per share of $3.80 (and adjusted for its recent stock split), Aflac currently trades at a forward P/E ratio of just 11.7. That's less than half of the S&P 500's current average P/E ratio. Given the stock's rising yield and low payout ratio (just over 27%), Aflac is a cheaply traded stock that should interest value and income investors alike.
A growth stock that's a perfect fit for value investors
At first glance, Skechers might not seem like a prototypical value stock. In fact, in some ways, it appears to be a stock that growth investors might be more interested in than value investors. After all, in 2017, Skechers' sales increased 16.9% to $4.16 billion and adjusted EPS rose 13.4% to $1.78. Its international sales, which now account for more than half of the company's total sales, is where growth has exploded over the past year. In the company's fourth quarter, international wholesale increased 40%, global retail 26%, and international comparable-store sales 16.5%.
In the company's fourth-quarter conference call, transcribed by S&P Global Market Intelligence, COO David Weinberg said the company would continue to invest in its global infrastructure as brand recognition increased worldwide:
With international representing over 50% of our total business, we continue to believe that the global market poses our strongest growth potential. We believe our relevant and innovative brand and diverse distribution allow us to grow in multiple product channels and markets. To this end, we are continuing to invest in our design, marketing and worldwide infrastructure for our near- and long-term success.
The strong growth is nice, but is the company a value? At first glance, it might not seem so but, dig a little deeper, and investors might discover shares are more of a value than they first appear. Based on its current price and adjusted earnings per share ($1.78), shares currently trade at a P/E ratio of about 23.6, barely below the S&P 500's average P/E ratio of 24.2. But using the 2018 analyst consensus of $2.30 in EPS, the company's forward P/E ratio drops considerably to 18.3.

Skechers domestic e-commerce sales grew by 22% in Q4. Image source: Skechers USA Inc.
Take Skechers' pristine and cash-rich balance sheet into account, however, and shares begin to look like an even better bargain. In Q4, Skechers had about $736 million in cash and cash equivalents on its balance sheet which comes out to about $4.70 per share, an incredible 12% of its market cap. When this cash is backed out of the company's share price, the forward P/E ratio falls to 16.2. For a company projected to grow sales and earnings by double-digit percentages, that's an incredible value.
A big network, a big yield, and a BIG value
Verizon Communications consistently earns recognition as the nation's top wireless network. While the company struggled for much of 2017 as aggressive marketing from competitors took its toll, the company ended the year on a high note, adding 431,000 phone subscribers in the fourth quarter, its largest increase in two years. Perhaps most exciting for Verizon shareholders, however, is its commitment to building out a 5G network before its rivals. In the company's fourth-quarter conference call, CEO Lowell McAdam said:
Only one carrier has been consistent in its actions and messaging regarding 5G. Verizon has the spectrum bandwidth needed to provide the rich services of true 5G, our intelligent edge network capabilities, and engineering know-how to lead the industry in providing the full suite of 5G gigabit services...The next industrial revolution will be on Verizon's network and will positively impact society like no technology we have seen before. As we say around our offices, we don't wait for the future, we build it, and we're doing it again with 5G.
Most Verizon investors probably prefer the stock for its high dividend yield over anything else and, based on its quarterly dividend of $0.59, the stock currently sports a yield of just under 5%. The payout ratio is 63%, nothing too concerning yet but is something to be watched to ensure it doesn't creep up too much higher.
Based on its adjusted EPS of $3.75, Verizon's shares are currently valued with a P/E of just 12.7, almost half the S&P 500's average. Given the company's steady business, reliable network, and the possibly upcoming 5G catalyst, this seemingly makes Verizon shares a bargain.
Why value investing works
By carefully examining stocks' quantitative and qualitative factors and attempting to buy a stock at prices below its intrinsic value, investors greatly increase their chances of beating the market. Some of the greatest investors the world has ever seen, like Warren Buffett, have used the principles of value investing to absolutely crush the market over long periods of time. I believe that in the cases of Aflac, Skechers, and Verizon, shares are currently priced below their intrinsic value and that, over the long-term, investors in each will be rewarded for their patience with market-beating returns.
More From The Motley Fool
Matthew Cochrane owns shares of Skechers and Verizon Communications. The Motley Fool owns shares of and recommends Skechers and Verizon Communications. The Motley Fool is short shares of IBM. The Motley Fool recommends Aflac. The Motley Fool has a disclosure policy.
