
 Yahoo Finance
 Berkshire Hathaway (BRK.B) Q2 Earnings & Revenues Rise Y/Y
Berkshire Hathaway (BRK.B) delivered second-quarter 2022 operating earnings of $9.3 billion, which increased 38.8% year over year. The increase was driven by higher earnings at Railroad, Utilities and Energy, as well as Manufacturing, Service and Retailing businesses.
Berkshire Hathaway Inc. Price, Consensus and EPS Surprise
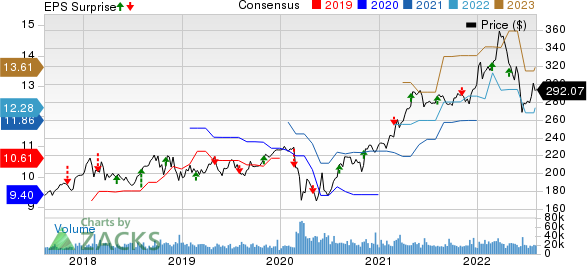
Berkshire Hathaway Inc. price-consensus-eps-surprise-chart | Berkshire Hathaway Inc. Quote
Behind the Headlines
Revenues increased 10.2% year over year to $76.2 billion, attributable to higher insurance premiums earned, sales and service revenues, leasing revenues, interest, dividend and other investment income in Insurance and Other as well as higher freight rail transportation revenues and energy operating revenues in Railroad, Utilities and Energy. The figure was higher than our estimate of $72.9 billion.
Costs and expenses increased 5.3% year over year to $54.5 billion, largely due to an increase in insurance losses and loss adjustment expenses, cost of sales and services, cost of leasing and interest expense. The figure was lower than our estimate of $64.8 billion.
Segment Performance
Berkshire Hathaway’s Insurance and Other segment revenues increased 10.1% year over year to $63 billion in the reported quarter on the back of higher insurance premiums earned, sales and service revenues, leasing revenues, interest, dividend and other investment income. The figure was higher than our estimate of $60.5 billion.
Insurance underwriting after-tax earnings increased 54.5% year over year. Underwriting earnings from reinsurance activities increased, reflecting foreign currency exchange rate gains arising from the re-measurement of non-U.S. dollar-denominated liabilities on insurance contracts of U.S. insurance subsidiaries.
Underwriting earnings from GEICO declined due to increases in claims frequencies and severities and lower reductions of ultimate claim estimates for prior years’ losses.
Railroad, Utilities and Energy operating revenues increased 10.6% year over year to $13.1 billion. The figure was higher than our estimate of $12.4 billion. Pre-tax earnings of Railroad increased 8.7% year over year to $2.1 billion. Pre-tax earnings of Utilities and Energy decreased 23.7% year over year to $564 million.
After-tax earnings of railroad business increased 9.8% year over year. The upside reflected higher revenue per car per unit. It was partly offset by lower overall freight volumes and higher fuel costs.
After-tax earnings of utilities and energy business increased 3.5% year over year on higher earnings from tax equity investments and from the natural gas pipeline and Northern Powergrid businesses. It was partly offset by lower earnings from the U.S. regulated utilities and real estate brokerage businesses.
Total revenues at Manufacturing, Service and Retailing increased 10.2% year over year to $42.6 billion. Pre-tax earnings increased 8% year over year to $4.3 billion.
After-tax earnings increased 8.2% in the second quarter of 2022. Solid customer demand for products and services in the first six months of 2022 was weighed down by higher materials, freight, labor and other input costs.
Financial Position
As of Jun 30, 2022, consolidated shareholders’ equity was $469.6 billion, down 8.8% from the level as of Dec 31, 2021. At quarter-end, cash and cash equivalents were $30.6 billion, down 65.3% from the level at 2021 end.
Berkshire exited the second quarter of 2022 with a float of about $147 billion, unchanged from the figure at year-end 2021.
Cash flow from operating activities totaled $15.4 billion in the reported quarter, down 21.5% from the year-ago period.
Berkshire Hathaway bought back shares worth $4.2 billion in the first half of 2022.
Zacks Rank
Berkshire currently carries a Zacks Rank #2 (Buy). You can see the complete list of today’s Zacks #1 Rank (Strong Buy) stocks here.
Performance of Some Other Insurers
Of the insurance industry players that have reported second-quarter results so far, The Hartford Financial Services Group, Inc. HIG, NMI Holdings NMIH and American Financial Group, Inc. AFG beat the respective Zacks Consensus Estimate for earnings.
The Hartford Financial Services Group reported second-quarter 2022 adjusted operating earnings of $2.15 per share, which beat the Zacks Consensus Estimate by 41.5%. The bottom line, however, decreased 8% year over year.
Hartford Financial’s operating revenues amounted to $3,765 million, which improved from $3,568 million in the second quarter of 2022. Also, the top line beat the consensus mark by 1.5%. The total earned premium of $4,810 million beat the consensus mark of $4,776.3 million and increased from $4,460 million a year ago. Net investment income of $541 million declined from $581 million a year ago due to lower annualized return on alternative investments. The reported figure was below the Zacks Consensus Estimate of $564.5 million.
NMI Holdings reported second-quarter 2022 operating net income per share of 86 cents, which beat the Zacks Consensus Estimate by 11.7%. The bottom line increased 28.4% year over year.
NMI Holdings’ total operating revenues of $132.2 million increased 9.5% year over year on higher net premiums earned (up 9%) and net investment income (up 16.4%). Revenues beat the Zacks Consensus Estimate by 1.3%.
Primary insurance-in-force increased 23% to $168.6 billion. Annual persistency was 71.5%, up 1760 basis points year over year. New insurance written was $16.6 billion, down 27% year over year, reflecting a decline in refinancing origination volume year on year.
American Financial Group reported second-quarter 2022 net operating earnings per share of $2.85, which surpassed the Zacks Consensus Estimate by 27.2%. The bottom line improved 19% year over year. Total revenues of $1.6 billion increased 11.1% year over year in the quarter. The growth came on the back of higher P&C insurance net earned premiums, net investment income and other income. The top line missed the Zacks Consensus Estimate by 3.9%.
Net investment income climbed 2.4% year over year to $168 million in the quarter under review driven by strong earnings from alternative investments, with an annualized return of approximately 12.4%. The figure was lower than our estimate of $237.8 million and missed the Zacks Consensus Estimate of $174.26 million.
Want the latest recommendations from Zacks Investment Research? Today, you can download 7 Best Stocks for the Next 30 Days. Click to get this free report
The Hartford Financial Services Group, Inc. (HIG) : Free Stock Analysis Report
Berkshire Hathaway Inc. (BRK.B) : Free Stock Analysis Report
American Financial Group, Inc. (AFG) : Free Stock Analysis Report
NMI Holdings Inc (NMIH) : Free Stock Analysis Report
To read this article on Zacks.com click here.
