
 Yahoo Finance
 What is Behind BWP Trust’s (ASX:BWP) Superior ROE?

BWP Trust (ASX:BWP) outperformed the Retail REITs industry on the basis of its ROE – producing a higher 14.02% relative to the peer average of 13.45% over the past 12 months. On the surface, this looks fantastic since we know that BWP has made large profits from little equity capital; however, ROE doesn’t tell us if management have borrowed heavily to make this happen. We’ll take a closer look today at factors like financial leverage to determine whether BWP’s ROE is actually sustainable. See our latest analysis for BWP Trust
Peeling the layers of ROE – trisecting a company’s profitability
Firstly, Return on Equity, or ROE, is simply the percentage of last years’ earning against the book value of shareholders’ equity. For example, if the company invests A$1 in the form of equity, it will generate A$0.14 in earnings from this. While a higher ROE is preferred in most cases, there are several other factors we should consider before drawing any conclusions.
Return on Equity = Net Profit ÷ Shareholders Equity
Returns are usually compared to costs to measure the efficiency of capital. BWP Trust’s cost of equity is 8.55%. Since BWP Trust’s return covers its cost in excess of 5.46%, its use of equity capital is efficient and likely to be sustainable. Simply put, BWP Trust pays less for its capital than what it generates in return. ROE can be dissected into three distinct ratios: net profit margin, asset turnover, and financial leverage. This is called the Dupont Formula:
Dupont Formula
ROE = profit margin × asset turnover × financial leverage
ROE = (annual net profit ÷ sales) × (sales ÷ assets) × (assets ÷ shareholders’ equity)
ROE = annual net profit ÷ shareholders’ equity

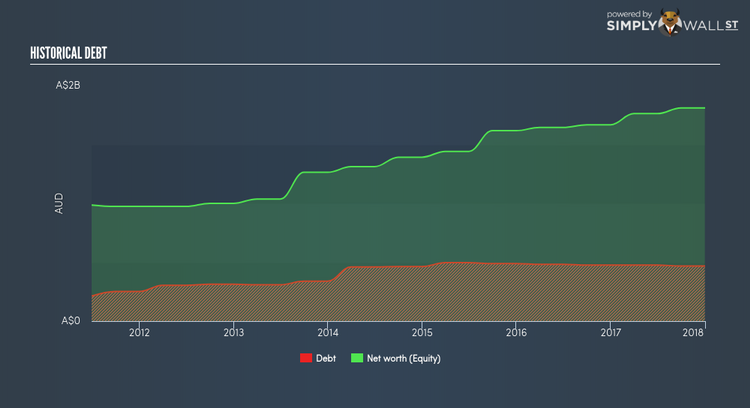
The first component is profit margin, which measures how much of sales is retained after the company pays for all its expenses. The other component, asset turnover, illustrates how much revenue BWP Trust can make from its asset base. The most interesting ratio, and reflective of sustainability of its ROE, is financial leverage. Since ROE can be inflated by excessive debt, we need to examine BWP Trust’s debt-to-equity level. The debt-to-equity ratio currently stands at a low 25.88%, meaning the above-average ROE is due to its capacity to produce profit growth without a huge debt burden.
Next Steps:
ROE is one of many ratios which meaningfully dissects financial statements, which illustrates the quality of a company. BWP Trust exhibits a strong ROE against its peers, as well as sufficient returns to cover its cost of equity. Its high ROE is not likely to be driven by high debt. Therefore, investors may have more confidence in the sustainability of this level of returns going forward. ROE is a helpful signal, but it is definitely not sufficient on its own to make an investment decision.
For BWP Trust, I’ve put together three essential aspects you should further examine:
Financial Health: Does it have a healthy balance sheet? Take a look at our free balance sheet analysis with six simple checks on key factors like leverage and risk.
Valuation: What is BWP Trust worth today? Is the stock undervalued, even when its growth outlook is factored into its intrinsic value? The intrinsic value infographic in our free research report helps visualize whether BWP Trust is currently mispriced by the market.
Other High-Growth Alternatives : Are there other high-growth stocks you could be holding instead of BWP Trust? Explore our interactive list of stocks with large growth potential to get an idea of what else is out there you may be missing!
To help readers see pass the short term volatility of the financial market, we aim to bring you a long-term focused research analysis purely driven by fundamental data. Note that our analysis does not factor in the latest price sensitive company announcements.
The author is an independent contributor and at the time of publication had no position in the stocks mentioned.
