
 Yahoo Finance
 What is Behind Alliant Energy Corporation’s (NYSE:LNT) Superior ROE?

This analysis is intended to introduce important early concepts to people who are starting to invest and want a simplistic look at the return on Alliant Energy Corporation (NYSE:LNT) stock.
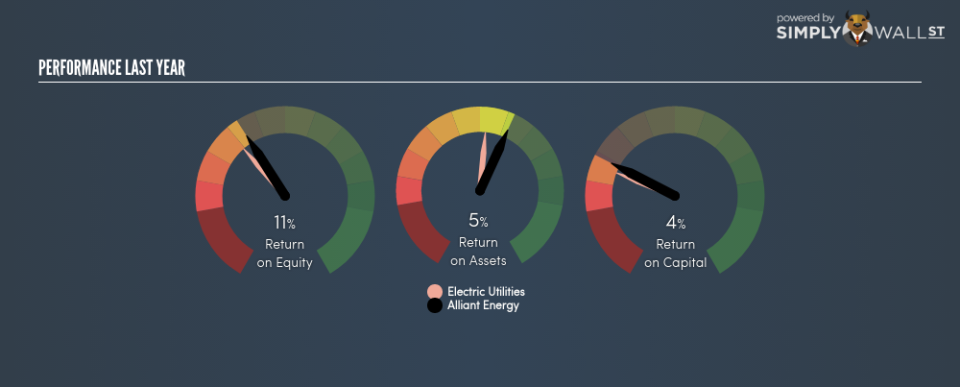
With an ROE of 10.78%, Alliant Energy Corporation (NYSE:LNT) outpaced its own industry which delivered a less exciting 9.38% over the past year. On the surface, this looks fantastic since we know that LNT has made large profits from little equity capital; however, ROE doesn’t tell us if management have borrowed heavily to make this happen. In this article, we’ll closely examine some factors like financial leverage to evaluate the sustainability of LNT’s ROE. View out our latest analysis for Alliant Energy
Peeling the layers of ROE – trisecting a company’s profitability
Return on Equity (ROE) is a measure of Alliant Energy’s profit relative to its shareholders’ equity. It essentially shows how much the company can generate in earnings given the amount of equity it has raised. While a higher ROE is preferred in most cases, there are several other factors we should consider before drawing any conclusions.
Return on Equity = Net Profit ÷ Shareholders Equity
Returns are usually compared to costs to measure the efficiency of capital. Alliant Energy’s cost of equity is 8.59%. This means Alliant Energy returns enough to cover its own cost of equity, with a buffer of 2.19%. This sustainable practice implies that the company pays less for its capital than what it generates in return. ROE can be dissected into three distinct ratios: net profit margin, asset turnover, and financial leverage. This is called the Dupont Formula:
Dupont Formula
ROE = profit margin × asset turnover × financial leverage
ROE = (annual net profit ÷ sales) × (sales ÷ assets) × (assets ÷ shareholders’ equity)
ROE = annual net profit ÷ shareholders’ equity
The first component is profit margin, which measures how much of sales is retained after the company pays for all its expenses. Asset turnover shows how much revenue Alliant Energy can generate with its current asset base. The most interesting ratio, and reflective of sustainability of its ROE, is financial leverage. Since financial leverage can artificially inflate ROE, we need to look at how much debt Alliant Energy currently has. Currently the debt-to-equity ratio stands at a balanced 120.59%, which means its above-average ROE is driven by its ability to grow its profit without a significant debt burden.

Next Steps:
ROE is a simple yet informative ratio, illustrating the various components that each measure the quality of the overall stock. Alliant Energy’s ROE is impressive relative to the industry average and also covers its cost of equity. ROE is not likely to be inflated by excessive debt funding, giving shareholders more conviction in the sustainability of high returns. Although ROE can be a useful metric, it is only a small part of diligent research.
For Alliant Energy, I’ve compiled three fundamental factors you should further examine:
Financial Health: Does it have a healthy balance sheet? Take a look at our free balance sheet analysis with six simple checks on key factors like leverage and risk.
Future Earnings: How does Alliant Energy’s growth rate compare to its peers and the wider market? Dig deeper into the analyst consensus number for the upcoming years by interacting with our free analyst growth expectation chart.
Other High-Growth Alternatives : Are there other high-growth stocks you could be holding instead of Alliant Energy? Explore our interactive list of stocks with large growth potential to get an idea of what else is out there you may be missing!
To help readers see pass the short term volatility of the financial market, we aim to bring you a long-term focused research analysis purely driven by fundamental data. Note that our analysis does not factor in the latest price sensitive company announcements.
The author is an independent contributor and at the time of publication had no position in the stocks mentioned.
