
 Yahoo Finance
 Avient's (NYSE:AVNT) 14% YoY earnings expansion surpassed the shareholder returns over the past three years
It hasn't been the best quarter for Avient Corporation (NYSE:AVNT) shareholders, since the share price has fallen 13% in that time. But that doesn't change the fact that the returns over the last three years have been respectable. In fact the stock is up 37%, which is better than the market return of 34%.
The past week has proven to be lucrative for Avient investors, so let's see if fundamentals drove the company's three-year performance.
See our latest analysis for Avient
While the efficient markets hypothesis continues to be taught by some, it has been proven that markets are over-reactive dynamic systems, and investors are not always rational. One imperfect but simple way to consider how the market perception of a company has shifted is to compare the change in the earnings per share (EPS) with the share price movement.
During three years of share price growth, Avient achieved compound earnings per share growth of 48% per year. This EPS growth is higher than the 11% average annual increase in the share price. Therefore, it seems the market has moderated its expectations for growth, somewhat.
The company's earnings per share (over time) is depicted in the image below (click to see the exact numbers).
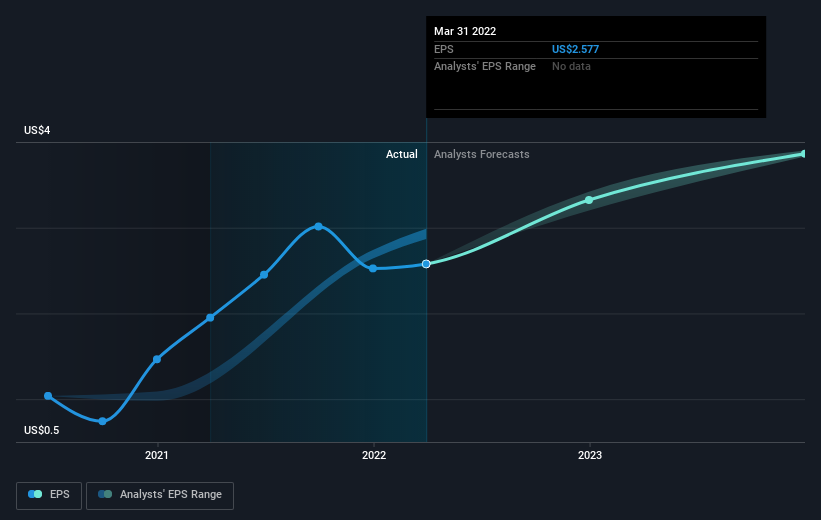
We know that Avient has improved its bottom line over the last three years, but what does the future have in store? Take a more thorough look at Avient's financial health with this free report on its balance sheet.
What About Dividends?
As well as measuring the share price return, investors should also consider the total shareholder return (TSR). The TSR incorporates the value of any spin-offs or discounted capital raisings, along with any dividends, based on the assumption that the dividends are reinvested. So for companies that pay a generous dividend, the TSR is often a lot higher than the share price return. As it happens, Avient's TSR for the last 3 years was 47%, which exceeds the share price return mentioned earlier. The dividends paid by the company have thusly boosted the total shareholder return.
A Different Perspective
While it's certainly disappointing to see that Avient shares lost 11% throughout the year, that wasn't as bad as the market loss of 17%. Of course, the long term returns are far more important and the good news is that over five years, the stock has returned 4% for each year. In the best case scenario the last year is just a temporary blip on the journey to a brighter future. I find it very interesting to look at share price over the long term as a proxy for business performance. But to truly gain insight, we need to consider other information, too. To that end, you should learn about the 2 warning signs we've spotted with Avient (including 1 which is potentially serious) .
But note: Avient may not be the best stock to buy. So take a peek at this free list of interesting companies with past earnings growth (and further growth forecast).
Please note, the market returns quoted in this article reflect the market weighted average returns of stocks that currently trade on US exchanges.
Have feedback on this article? Concerned about the content? Get in touch with us directly. Alternatively, email editorial-team (at) simplywallst.com.
This article by Simply Wall St is general in nature. We provide commentary based on historical data and analyst forecasts only using an unbiased methodology and our articles are not intended to be financial advice. It does not constitute a recommendation to buy or sell any stock, and does not take account of your objectives, or your financial situation. We aim to bring you long-term focused analysis driven by fundamental data. Note that our analysis may not factor in the latest price-sensitive company announcements or qualitative material. Simply Wall St has no position in any stocks mentioned.
