
 Yahoo Finance
 AUD/USD Forex Technical Analysis – October 16, 2018 Forecast
The Australian Dollar is trading nearly flat and inside yesterday’s range. This indicates investor indecision and impending volatility. Earlier in the session, the Reserve Bank of Australia released its latest monetary policy minutes.
The minutes showed that RBA board members worried that lending conditions could tighten further as the royal commission into the financial services sector continues.
The cash rate has been at 1.5 percent since August 2016 and RBA officials in the latest minutes gave no indication of a near-term change in their patient policy stance and said they “continue to agree that the next move in the cash rate was more likely to be an increase than a decrease”.
At 0454 GMT, the AUD/USD is trading .7123, down 0.0007 or -0.10%.
Daily Technical Analysis
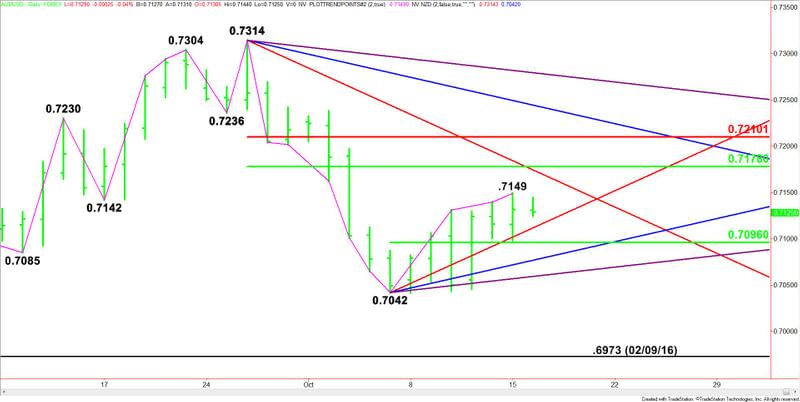
The main trend is down according to the daily swing chart. However, momentum is trending higher. A trade through .7149 will indicate the buying is getting stronger. A move through .7042 will signal a resumption of the downtrend.
The minor trend is up. This is why momentum is trending higher. A trade through .7098 will change the minor trend to down. This will also shift momentum to the downside.
The short-term range is .7042 to .7149. Its 50% level or pivot at .7096 is support. This level is controlling the short-term direction of the market.
The main range is .7314 to .7042. Its retracement zone at .7178 to .7210 is the primary upside target. Since the main trend is down, sellers are likely to come in on the first test of this zone. Overtaking it will indicate the buying is getting stronger.
Daily Technical Forecast
Based on the early price action, the direction of the AUD/USD the rest of the session is likely to be determined by trader reaction to the uptrending Gann angle at .7112. This angle has been guiding the market higher since October 5.
Holding the angle at .7112 will indicate the presence of buyers. If this creates enough upside momentum then look for buyers to take out .7149. This should lead to a test of the downtrending Gann angle at .7174, followed closely by the 50% level at .7178.
Taking out .7112 will signal the presence of sellers. This could drive the AUD/USD into the short-term pivot at .7096. Aggressive counter-trend buyers could come in on a test of this level. They will be trying to produce a secondary higher bottom.
If 7096.00 fails as support then look for the selling to extend into a pair of uptrending Gann angles at .7077 and .7060. The latter is the last potential support angle before the .7042 main bottom.
This article was originally posted on FX Empire
