AUD/JPY Trading In Line With The Slope
DailyFX.com -
Searching For Concise Recommendations That Can Improve Your Trading Skills? Then Our Traits Of Successful Traders Guide Is An Excellent Material For You! Obtain Them HERE
Talking Points:
Strong previous week for AUD/JPY to the upside
AUD/JPY retracing from yesterday’s session drop
Key resistance might send AUD/JPY to lower levels
Introduction:
Last week was a good week for the Australian Dollar vs the Japanese Yen as AUD/JPY advanced 2.22%. However, Trading seems to have turned around and now, this week the Japanese Yen seems to be in control of the trading activity.
Let’s take a look at our short-term and long term charts in order to gain better perspective of what has been happening with this cross.
Short-Term Technical Outlook:
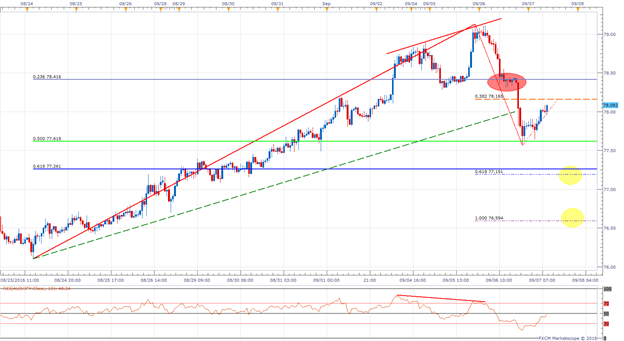
As depicted in the chart below, during the last 11 trading days, AUD/JPY traded strongly to the upside. During these previous 11 days, the cross limited its drops at the support line drawn from the August low. However, it was not until last night’s trading activity during the Sydney’s session that the cross finally broke the above mentioned support slope line. As can be observed, at the moment the cross registered its highest price level within this trend, the cross already presented signs of divergence between our 13 period RSI and price action therefore signaling a potential scenario for a stronger drop.
After breaking with a strong move to the downside, AUD/JPY found new support at the 50% Fibonacci retracement from the August’s 24 low and September 5 high. From this level, the cross has retraced to the upside and seems that AUD/JPY is in search of the 38.2% Fibonacci Retracement from the above mentioned downside move. If this scenario proves to be right, targets should be focusing on the 61.8% Fibonacci expansion from the September 5 high and the 50% Fibonacci retracement. As a second target the 100%, Fibonacci Expansion from the above mentioned move should be considered.
Next, we will observe bigger time frames to support our analysis.
AUD/JPY H1 Chart
Chart created using FXCM’s Trading Station
Bigger Picture:
AUD/JPY D1 Chart:
Chart created using FXCM’s Trading Station
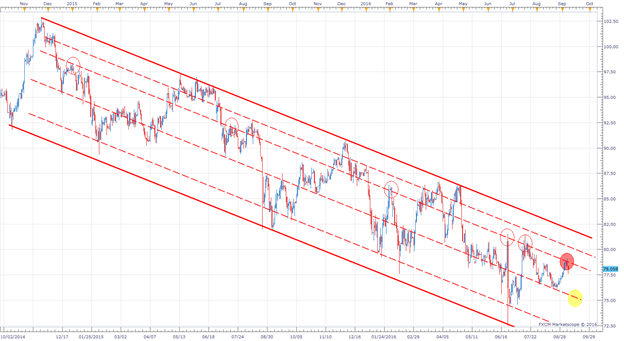
As can be observed in the chart above, AUD/JPY has been trading in a symmetrical downward slope price channel Since October of 2014. A negative slope from the November high of 2014 rules this symmetrical price channel. However, not all trading is limited between movements of the two external lines of this channel, as we can observe that within this price channel there seem to be other important lines that have worked as either support or resistance. These internal lines within the symmetrical price channel are drawn with the same exact slope as the external lines. Therefore, it can be concluded that trading action for AUD/JPY respects this slope.
As of yesterday’s trading session, we touched one of the internal lines of this price channel. If we pay attention, this level has worked as great resistance over the last two years for AUD/JPY in its way of lower prices. Thus, we JPY strength is expected over AUD in the upcoming sessions targeting the next lower slope line within the price channel.
Bottom Line:
Given that currently we are seeing AUD/JPY retracing from last night’s trading action, this movement offers a great price level for traders targeting lower levels. This aligns with the analysis offered by our bigger picture that JPY might strengthen over AUD in the upcoming sessions targeting the next lower slope line.
As a contrary perspective, if prices break above the 38.2% Fibonacci retracement zone and are able to break as well the 23.6% Fibonacci retracement of the August low and September high. This would set AUD/JPY on a retest of the resistance negative slope line of our bigger picture analysis.
Are you interested in knowing what are the Top Trading Opportunities of 2016? CLICK HERE!
Are you a scalper? Then GSI is a tool that could help you on your short-term trades! Check it out HERE
Written by Quasar Elizundia
DailyFX provides forex news and technical analysis on the trends that influence the global currency markets.
Learn forex trading with a free practice account and trading charts from FXCM.

 Yahoo Finance


