
 Yahoo Finance
 Aspial Corporation Limited (SGX:A30): Can It Deliver A Superior ROE To The Industry?

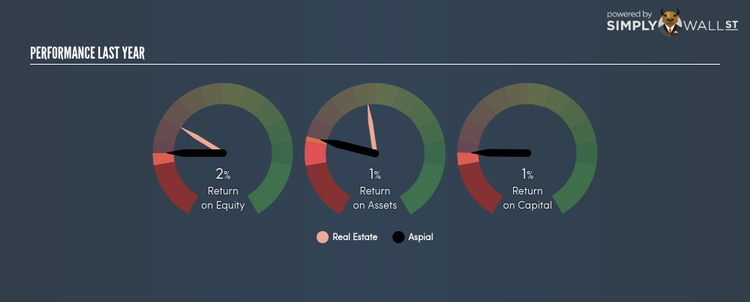
Aspial Corporation Limited (SGX:A30) delivered a less impressive 1.62% ROE over the past year, compared to the 6.62% return generated by its industry. A30’s results could indicate a relatively inefficient operation to its peers, and while this may be the case, it is important to understand what ROE is made up of and how it should be interpreted. Knowing these components could change your view on A30’s performance. Metrics such as financial leverage can impact the level of ROE which in turn can affect the sustainability of A30’s returns. Let me show you what I mean by this. View our latest analysis for Aspial
Breaking down ROE — the mother of all ratios
Return on Equity (ROE) weighs Aspial’s profit against the level of its shareholders’ equity. It essentially shows how much the company can generate in earnings given the amount of equity it has raised. While a higher ROE is preferred in most cases, there are several other factors we should consider before drawing any conclusions.
Return on Equity = Net Profit ÷ Shareholders Equity
ROE is measured against cost of equity in order to determine the efficiency of Aspial’s equity capital deployed. Its cost of equity is 15.46%. This means Aspial’s returns actually do not cover its own cost of equity, with a discrepancy of -13.85%. This isn’t sustainable as it implies, very simply, that the company pays more for its capital than what it generates in return. ROE can be split up into three useful ratios: net profit margin, asset turnover, and financial leverage. This is called the Dupont Formula:
Dupont Formula
ROE = profit margin × asset turnover × financial leverage
ROE = (annual net profit ÷ sales) × (sales ÷ assets) × (assets ÷ shareholders’ equity)
ROE = annual net profit ÷ shareholders’ equity
The first component is profit margin, which measures how much of sales is retained after the company pays for all its expenses. Asset turnover shows how much revenue Aspial can generate with its current asset base. Finally, financial leverage will be our main focus today. It shows how much of assets are funded by equity and can show how sustainable the company’s capital structure is. Since financial leverage can artificially inflate ROE, we need to look at how much debt Aspial currently has. Currently the debt-to-equity ratio stands at more than 2.5 times, which means its below-average ROE is already being driven by significant debt levels.

Next Steps:
ROE is one of many ratios which meaningfully dissects financial statements, which illustrates the quality of a company. Aspial’s below-industry ROE is disappointing, furthermore, its returns were not even high enough to cover its own cost of equity. However, ROE is not likely to be inflated by excessive debt funding, giving shareholders more conviction in the sustainability of returns, which has headroom to increase further. Although ROE can be a useful metric, it is only a small part of diligent research.
For Aspial, there are three pertinent factors you should look at:
Financial Health: Does it have a healthy balance sheet? Take a look at our free balance sheet analysis with six simple checks on key factors like leverage and risk.
Future Earnings: How does Aspial’s growth rate compare to its peers and the wider market? Dig deeper into the analyst consensus number for the upcoming years by interacting with our free analyst growth expectation chart.
Other High-Growth Alternatives : Are there other high-growth stocks you could be holding instead of Aspial? Explore our interactive list of stocks with large growth potential to get an idea of what else is out there you may be missing!
To help readers see pass the short term volatility of the financial market, we aim to bring you a long-term focused research analysis purely driven by fundamental data. Note that our analysis does not factor in the latest price sensitive company announcements.
The author is an independent contributor and at the time of publication had no position in the stocks mentioned.
