
 Yahoo Finance
 Apple's (AAPL) Q1 Earnings Beat, iPhone Sales Increase Y/Y
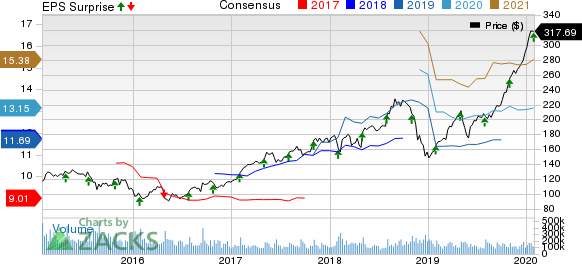
Apple AAPL reported first-quarter fiscal 2020 earnings of $4.99 per share that beat the Zacks Consensus Estimate by 9.9% and increased 19.4% year over year.
Net sales increased 8.9% year over year to $91.82 billion, which surpassed the Zacks Consensus Estimate of $87.74 billion. The figure also beat management’s guidance of $85.5-$89.5 billion. However, foreign exchange volatility negatively impacted sales by $1 billion.
Product sales (86.2% of sales) increased 7.7% to $79.10 billion. Services (13.8% of sales) revenues grew 16.9% from the year-ago quarter to $12.72 billion.
Active installed base of devices surpassed 1.5 billion, up more than 100 million in the past 12 months.
Geographical Performance
Americas sales rose 12% year over year to $41.37 billion and accounted for 45.1% of total sales.
Europe generated $23.27 billion in sales, up 14.3% on a year-over-year basis. The region accounted for 25.3% of total sales.
Greater China sales rose 3.1% from the year-ago quarter to $13.58 billion and accounted for 14.8% of total sales. Apple stated that the Services segment grew at a double-digit rate in China.
Japan sales declined 9.9% year over year to $6.22 billion and accounted for 6.8% of total sales.
Rest of the Asia Pacific generated sales of $7.38 billion, up 6.5% year over year. The region accounted for 8% of total sales.
Apple established new first-quarter records in the United States, Canada, Mexico, Brazil, the U.K., Germany, France, Italy, Spain, Poland, Thailand, Malaysia and Vietnam.
iPhone Sales Details
iPhone sales increased 7.6% from the year-ago quarter to $55.96 billion and accounted for 60.9% of total sales. Customer response was exceptional for the new iPhone 11, 11 Pro and 11 Pro max. Moreover, sales benefited from trade-in programs, which doubled on a year-over-year basis.
Active installed base of iPhone reached a new all-time high in each of the company’s geographic segments.
Apple quoted a recent survey report from 451 Research, which stated that customer satisfaction was 98% for iPhone 11, iPhone 11 Pro and 11 Pro Max combined.
Services Momentum Continues
Services maintained momentum in the reported quarter. The company witnessed double-digit growth across all geographic segments. Robust performance of cloud services, music, payment services and the App Store search ad business drove Services revenues. App Store and AppleCare reported a record first-quarter performance in the company’s history.
Apple has now more than 480 million paid subscribers across its Services portfolio, up 30 million sequentially and 120 million year over year. Third-party subscription revenues increased 40% year over year.
iPad & Mac Details
iPad sales of $5.98 billion decreased 11.2% year over year and accounted for 6.5% of total sales. The decline can be primarily attributed to difficult comparisons due to the launch of iPad Pro in the year-ago quarter.
iPad sales were strong in key emerging markets like Mexico, India, Turkey, Poland, Thailand, Malaysia, the Philippines and Vietnam.
Additionally, more than half of the customers, who purchased iPads during the quarter, were new to the device. iPad’s active installed base also reached a new all-time high.
Apple quoted a recent survey report from 451 Research, which stated that overall consumer and business satisfaction was 93% and 92%, respectively, for iPad.
Mac sales of $7.16 billion decreased 3.5% from the year-ago quarter and accounted for 7.8% of total sales. The decline can be primarily attributed to difficult comparisons due to the launch of MacBook Air and Mac Mini in the year-ago quarter.
Apple launched the 16-inch MacBook Pro, its most powerful notebook ever, during the reported quarter. Moreover, the company also launched Mac Pro and Pro Display XDR.
Globally, more than half of the customers, who bought Macs during the quarter, were new to the device. Active installed base of Mac also reached a new all-time high.
Wearables’ Robust Performance
Wearables, Home and Accessories sales surged 37% year over year to $10.01 billion and accounted for 10.9% of total sales. Wearables grew 44% year over year.
The solid year-over-year growth was driven by strong demand for AirPods and Apple Watch. AirPod sales benefited from the launch of AirPod Pro, which features active noise cancellation.
Moreover, Apple Watch’s adoption rate grew rapidly. Notably, more than 75% of customers who purchased Apple Watch during the reported quarter were first-time customers.
Apple Gaining Traction Among Enterprises
Apple is gaining traction among enterprises, particularly end markets like healthcare.
The company stated that 100% of the Fortune 500 companies in the sector are using Apple’s technology in areas like patient experience, clinical communications and nursing workflows.
Operating Details
Gross margin expanded 40 basis points (bps) on a year-over-year basis to 38.4%, which was within management’s guidance of 37.5-38.5%.
Operating expenses rose 11.1% year over year to $9.65 billion due to higher research & development (R&D), and selling, general & administrative (SG&A) expenses, which grew 14.1% and 8.7%, respectively. The operating expenses figure was close to the lower end of management’s guidance of $9.6-$9.8 billion.
Operating margin expanded 20 bps on a year-over-year basis to 27.8%.
Balance Sheet & Cash Flow
As of Dec 28, 2019, cash & marketable securities were $207.06 billion compared with $205.89 billion as of Sep 30.
Term debt, as of Dec 28, was $93.08 billion, up from $98.47 billion as of Sep 30.
Apple issued a €2-billion green bond, retired $1 billion of maturing debt and reduced commercial paper by $1 billion during the reported quarter. As of Dec 28, total debt was $108 billion.
Cash flow from operations was $30.5 billion in the first quarter compared with $19.9 billion in the previous quarter.
Apple returned almost $25 billion in the reported quarter through dividend payouts and share repurchases. The company repurchased 40 million shares for $10 billion and paid out $3.5 billion in dividends.
Moreover, it declared a cash dividend of 77 cents per share to be payable on Feb 13, 2020, to shareholders of record as of Feb 10.
Guidance
For second-quarter fiscal 2020, revenues are projected between $63 billion and $67 billion.
The Zacks Consensus Estimate for second-quarter sales is pegged at $62.51 billion, indicating growth of 7.8% from the figure reported in the year-ago quarter.
Gross margin is expected to be 38-39%, while operating expenses are projected to be $9.6-$9.7 billion.
Gross margin is expected to be flat sequentially, owing to better mix (due to higher contribution from Services business) and cost savings that will offset second-quarter seasonality.
However, growth rate of operating expenses, as a percentage of revenues, is higher compared to prior quarters due to investments related to the baseband business acquired from Intel INTC and the Apple TV+ streaming service.
Other income/(expense) is estimated to be $250 million, while the tax rate is expected to be 16.5%.
Apple expects the number of paid subscribers to surpass 0.6 billion before the end of calendar 2020.
Zacks Rank & Other Stocks to Consider
Apple currently carries a Zacks Rank #2 (Buy).
MSCI MSCI and Waters Corp. WAT are a couple of similar-ranked stocks in the broader computer and technology sector. You can see the complete list of today’s Zacks #1 Rank (Strong Buy) stocks here.
MSCI and Waters Corp. are expected to report quarterly results on Jan 30 and Feb 4, respectively.
Looking for Stocks with Skyrocketing Upside?
Zacks has just released a Special Report on the booming investment opportunities of legal marijuana.
Ignited by new referendums and legislation, this industry is expected to blast from an already robust $6.7 billion to $20.2 billion in 2021. Early investors stand to make a killing, but you have to be ready to act and know just where to look.
See the pot trades we're targeting>>
Click to get this free report MSCI Inc (MSCI) : Free Stock Analysis Report Apple Inc. (AAPL) : Free Stock Analysis Report Waters Corporation (WAT) : Free Stock Analysis Report Intel Corporation (INTC) : Free Stock Analysis Report To read this article on Zacks.com click here. Zacks Investment Research
