
 Yahoo Finance
 ANSYS (ANSS) Q1 Earnings Beat, Coronavirus Dims '20 View
ANSYS ANSS reported first-quarter 2020 non-GAAP earnings of 83 cents per share, which beat the Zacks Consensus Estimate by 6.4%. The bottom line declined 35.7% year over year.
Non-GAAP revenues of $308.9 million surpassed the Zacks Consensus Estimate of $307 million. The figure declined 3.4% (down 2.6% at constant currency or cc) from the year-ago quarter. Decline in multi-year lease contracts weighed on the top line.
Negative business impacts across China owing to COVID-19 outbreak and trade restrictions affected the first quarter performance.
As of Mar 31, 2020, total deferred revenues and backlog came in at $835 million, reflecting an increase of 24% on a year-over-year basis.

Coming to the price performance, shares of ANSYS have gained 41.9% in the past year, outperforming the industry’s rally of 23.2%.
Top-Line Details
Total revenues came in nearly $305 million, down 3.8% year over year. Software licenses revenues (28.8% of total revenues) were $87.8 million, down 28.6% year over year. Maintenance and Service revenues (71.2% of total revenues) came in at $217.2 million, up 11.9% year over year.
Lease licenses revenues (14.5% of non-GAAP revenues) declined 35% at cc to $44.9 million due to an anticipated and substantial reduction in multi-year lease contracts. Perpetual licenses revenues (13.9%) fell 19.7% year over year at cc to $43 million.
Maintenance revenues and Service revenues improved 12.2% and 33%, year over year, at cc, to $204.3 million and $16.7 million, contributing 66.1% and 5.4% to non-GAAP revenues, respectively. Service revenue growth reflected broader adoption of the company’s simulation tools and benefits from acquisitions.
Direct and indirect channels contributed 73% and 27%, respectively, to non-GAAP revenues. ACV remained flat year over year on cc basis.
On a geographic basis, revenues from Americas, EMEA (comprising Germany, the United Kingdom and other EMEA) and the Asia-Pacific (Japan and Other Asia-Pacific) accounted for 43.1%, 29.2% and 27.7% of non-GAAP revenues, respectively.
Notably, at cc, revenues from Americas declined 9.7%, while revenues from EMEA and the Asia-Pacific improved 1.1% and 6.2% year over year, respectively.
New deal wins in high-tech and automotive verticals across the Asia-Pacific aided growth. Strength in automotive sector with growing clout of cost-effective 3D printing solutions fueling demand for additive manufacturing solutions, favored growth in the EMEA region. Meanwhile, performance across Americas was due to anticipated reduction in multi-year lease contracts.
Operating Details
Non-GAAP gross margin contracted 310 basis points (bps) on a year-over-year basis to 88%, owing to lower revenue base.
Selling, general & administrative expenses as a percentage of total revenues expanded 740 bps to 42.8%. Research & development expenses as a percentage of revenues expanded 590 bps year over year to 28.2%.
Non-GAAP operating margin came in at 29.3% compared with 42.9% reported in the year-ago quarter on account of decline in gross margin and higher expenses.
Balance Sheet & Cash Flow
As of Mar 31, 2020, cash and short-term investments of $718 million (the United States comprised 60%) compared with $872.4 million (the United States comprised 72%) as of Dec 31, 2019.
As of Mar 31, 2020, the company has an unsecured term loan with an outstanding principal balance of $425 million. Notably, the debt agreement currently requires no principal payments through the next 12 months.
The company generated cash from operations of $147.4 million compared with $139.5 million in the prior quarter.
ANSYS Inc Price, Consensus and EPS Surprise
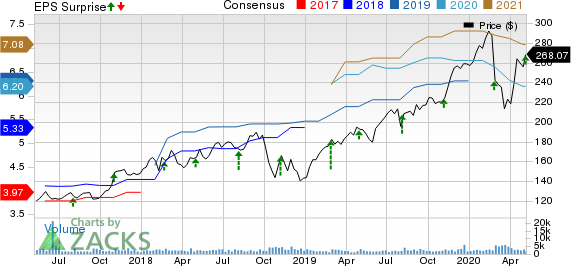
ANSYS Inc price-consensus-eps-surprise-chart | ANSYS Inc Quote
Further, the company repurchased 0.7 million shares in first quarter at an average price of $233.48 per share. As of Mar 31, 2020, the company had 2.8 million shares remaining under the share buyback program.
Guidance
ANSYS expects the coronavirus outbreak to delay ACV and related revenues to the second half of the year. Moreover, trade restrictions imposed on certain entities that were put into effect in 2019 are expected to persist in 2020.
ANSYS expects non-GAAP earnings in the range of $1.01-$1.33 per share for second-quarter 2020. The Zacks Consensus Estimate is pegged at $1.41 per share.
Non-GAAP revenues are anticipated between $335 million and $375 million. The Zacks Consensus Estimate stands at $379.9 million.
Management projects non-GAAP operating margin in the range of 33.5-39%.
For 2020, ANSYS has trimmed guidance. The company now expects non-GAAP revenues of $1.555-$1.63 billion compared with the prior range of $1.64-$1.70 billion. The Zacks Consensus Estimate is pegged at $1.63 billion.
Non-GAAP earnings are now envisioned in the range of $5.61-$6.23 per share (mid-point of $5.92) compared with the prior range of $6.19-$6.71. The Zacks Consensus Estimate for earnings is at $6.20 per share.
ACV is now anticipated between $1.5 billion and $1.575 billion compared with the prior range of $1.605-$1.650 billion.
Non-GAAP operating margin is now expected in the range of 40-42%, compared with the earlier guided range of 42-43%.
The company now anticipates operating cash flow for 2020 in the range of $425-$470 million compared with the previous range of $500-$530 million.
Zacks Rank & Stocks to Consider
Currently, ANSYS carries a Zacks Rank #3 (Hold).
ASE Technology Holding Co., Ltd. ASX, Twilio Inc. TWLO and InterDigital, Inc. IDCC are some better-ranked stocks worth considering in the broader computer and technology sector, each flaunting a Zacks Rank #1 (Strong Buy). You can see the complete list of today’s Zacks #1 Rank stocks here.
Long-term earnings growth rate for ASE Technology, Twilio and InterDigital is pegged at 26.63%, 26.61% and 15%, respectively.
5 Stocks Set to Double
Each was hand-picked by a Zacks expert as the #1 favorite stock to gain +100% or more in 2020. Each comes from a different sector and has unique qualities and catalysts that could fuel exceptional growth.
Most of the stocks in this report are flying under Wall Street radar, which provides a great opportunity to get in on the ground floor.
Today, See These 5 Potential Home Runs >>
Want the latest recommendations from Zacks Investment Research? Today, you can download 7 Best Stocks for the Next 30 Days. Click to get this free report
ANSYS Inc (ANSS) : Free Stock Analysis Report
InterDigital Inc (IDCC) : Free Stock Analysis Report
Advanced Semiconductor Engineering Inc (ASX) : Free Stock Analysis Report
Twilio Inc (TWLO) : Free Stock Analysis Report
To read this article on Zacks.com click here.
Zacks Investment Research
