
 Yahoo Finance
 AMTD or IBKR: Which Investment Broker Is More Attractive?


The investment management industry is well positioned for growth, given the stabilizing economy and gradually improving interest-rate scenario. Most investment managers waived off majority of their fees with the rates rising since 2016 and this decline in fee waivers is expected to continue aiding top-line growth in the upcoming quarters.
Notably, as investment brokers earn interest income on un-invested cash in customer accounts, the rate hikes will enable them to invest at higher rates. Thus, brokerage firms will likely engage in more investment activities as rates increase, which will boost their interest income.
Further, in the near term, brokerage firms will be able to grow their trading volumes driven by the expected improvement in equity markets, rising rate environment as well as their innovative trading platforms.
Therefore, we are focusing on two investment brokers, TD Ameritrade Holding Corp. AMTD and Interactive Brokers Group, Inc. IBKR, which seem to be well positioned for the future, based on their underlying strength and growth prospects.
TD Ameritrade has a market cap of $28.85 billion and provides securities brokerage services and technology-based financial services to retail investors, traders and independent registered investment advisors. On the other hand, Interactive Brokers, with a market cap of $24.72 billion, operates as an automated global electronic market maker and broker and specializes in routing orders, beside executing and processing trades in securities, futures, foreign exchange instruments, bonds and mutual funds.
Both TD Ameritrade and Interactive Brokers currently carry a Zacks Rank #2 (Buy). You can see the complete list of today’s Zacks #1 Rank (Strong Buy) stocks here.
Though both brokerage firms have similar business trends, deeper research into the financials will help decide which investment option is better.
Price Performance
While, both the firms have outperformed the industry (up 19.6%) over the past year, Interactive Brokers’ performance has been better. Its shares have surged 87% in the last 12 months compared with 50.1% rally of the shares of TD Ameritrade.
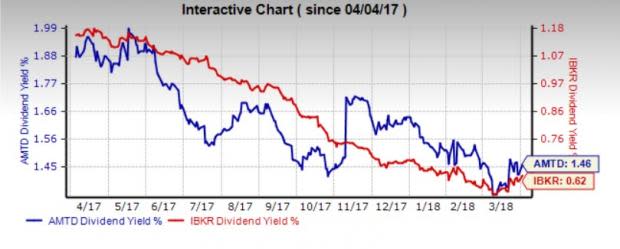
Dividend Yield
While both the companies have been deploying capital in terms of dividend payments to enhance shareholder value, TD Ameritrade has an edge over Interactive Brokers in this case. This is because TD Ameritrade has a dividend yield of 1.46% while Interactive Brokers has a dividend yield of 0.62%.
Moreover, TD Ameritrade’s current dividend yield also compares favorably with the industry average of 1.29%.
Leverage Ratio
Here, Interactive Brokers seems to be better positioned than TD Ameritrade. This is because Interactive Brokers does not use any debt to finance its operations while TD Ameritrade, which uses debt, has a debt-to-equity ratio of 0.35. In fact, TD Ameritrade’s ratio also comes higher than the industry average of 0.25.
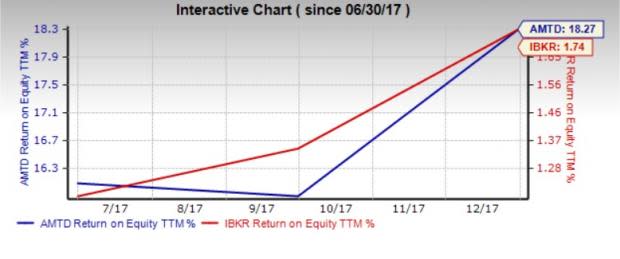
Return on Equity (ROE)
ROE is a measure of a company’s efficiency in utilizing shareholder’s funds. ROE for the trailing 12-months for Interactive Brokers and TD Ameritrade is 1.74% and 18.27%, respectively. While TD Ameritrade seems to be better positioned in terms of reinvesting its earnings when compared with Interactive Brokers, it is also more efficient than its peers as the ROE for the industry is 10.34%.
Earnings Growth Projections
For Interactive Brokers, the Zacks Consensus Estimate for earnings per share is pegged at $2.10 for 2018, representing year-over-year growth of 37.3%. The stock has long-term expected earnings per share growth rate of 10%.
For TD Ameritrade, the Zacks Consensus Estimate stands at $3.04 for fiscal 2018, reflecting a year-over-year increase of 65.2%. The stock has long-term expected earnings per share growth rate of 20%.
This round is biased toward TD Ameritrade.
Sales Growth Projections
For Interactive Brokers, the Zacks Consensus Estimate for sales is $1.84 billion for 2018, reflecting 8.1% rise from the prior year.
For TD Ameritrade, the consensus estimate for sales stands at $5.20 billion for fiscal 2018, indicating growth of 41.4% year over year.
Therefore, TD Ameritrade has an edge here as well.
Conclusion
Our comparative analysis shows that TD Ameritrade is better positioned than Interactive Brokers when considering dividend yield, earnings and sales growth expectations and reinvesting potential. Interactive Brokers wins on better price performance and leverage position.
The Hottest Tech Mega-Trend of All
Last year, it generated $8 billion in global revenues. By 2020, it's predicted to blast through the roof to $47 billion. Famed investor Mark Cuban says it will produce "the world's first trillionaires," but that should still leave plenty of money for regular investors who make the right trades early.
See Zacks' 3 Best Stocks to Play This Trend >>
Want the latest recommendations from Zacks Investment Research? Today, you can download 7 Best Stocks for the Next 30 Days. Click to get this free report
Interactive Brokers Group, Inc. (IBKR) : Free Stock Analysis Report
TD Ameritrade Holding Corporation (AMTD) : Free Stock Analysis Report
To read this article on Zacks.com click here.
Zacks Investment Research
