
 Yahoo Finance
 Agilent (A) Q4 Earnings Surpass Estimates, Revenues Rise Y/Y
Agilent Technologies A reported fourth-quarter fiscal 2022 earnings of $1.53 per share, beating the Zacks Consensus Estimate by 10.1%. The bottom line increased 26.4% from the year-ago fiscal quarter’s level and 14.2% sequentially.
Revenues of $1.85 billion surpassed the Zacks Consensus Estimate by 4.5%. The top line was up 11% on a reported basis and 17% on a core basis from the respective year-ago fiscal quarter’s levels. Revenues increased 7.6% from the prior fiscal quarter’s figure.
Top-line growth was driven by continued strong progress in the pharma and applied markets. Also, robust demand across all end markets in China remained a positive.
Agilent Technologies, Inc. Price, Consensus and EPS Surprise
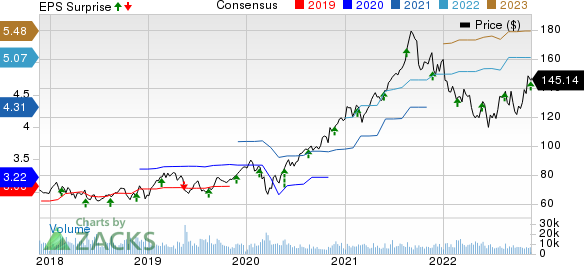
Agilent Technologies, Inc. price-consensus-eps-surprise-chart | Agilent Technologies, Inc. Quote
Segmental Top-Line Details
Agilent has three reporting segments, namely Life Sciences & Applied Markets Group (LSAG), Agilent Cross Lab Group (ACG), and Diagnostics and Genomics Group (DGG).
LSAG: The segment accounted for $1.12 billion or 60% of its total revenues, up 16% on a reported basis and 22% on a core basis from the respective prior-year fiscal quarter’s levels. This was driven by a positive environment across the Pharma, Chemical & Advanced Materials, Food, and Environmental & Forensics markets. Growth in LC, LC-MS, GC and GC-MS instruments also aided results.
ACG: Revenues from the segment were $381 million, accounting for 21% of total revenues. Also, the top line improved 7% from the prior-year fiscal quarter’s reading on a reported basis and 14% on a core basis, driven by an increased service agreement attach rate.
DGG: Revenues increased 3% from the prior-year fiscal quarter’s tally on a reported basis and 8% on a core basis to $352 million, accounting for the remaining 19% of total revenues. Segmental growth was attributed to strength in the NASD and Genomics portfolio.
Operating Results
For the fiscal fourth quarter, gross margin in the LSAG segment expanded 70 basis points (bps) to 60.6% from the prior-year fiscal quarter’s number. ACG gross margin expanded 30 bps to 47%. DGG’s gross margin contracted 150 bps from the year-ago fiscal quarter’s actuals to 51%.
Research & development (R&D) costs were $119 million, up 2.6% from the prior-year fiscal quarter’s number. Selling, general & administrative (S,G&A) expenses were $422 million, up 8.5% from the year-earlier fiscal quarter’s figure. As a percentage of revenues, R&D and S,G&A expenses contracted 55 bps and 61 bps each to 6.4% and 22.8%, respectively, from the comparable year-ago fiscal quarter’s readings.
Operating margin for the fiscal fourth quarter was 29.1%, up 260 bps from the year-earlier fiscal quarter’s figure.
Segmentwise, the operating margin for LSAG was up 400 bps from the year-earlier fiscal quarter’s level to 32.7%. ACG’s operating margin was 27.4%, up 110 bps from the year-ago fiscal quarter’s level. DGG segment’s operating margin contracted 130 bps to 19.5% from the year-ago fiscal quarter’s tally.
Balance Sheet
As of Oct 31, 2022, Agilent’s cash and cash equivalents were $1.05 billion, down from $1.07 billion on Jul 31, 2022.
Accounts receivables were $1.41 billion at the end of fourth-quarter fiscal 2022, up from $1.35 billion at the end of third-quarter fiscal 2022.
Long-term debt was $2.733 billion for the reported quarter, up from $2.732 billion in the prior fiscal quarter.
Outlook
For the fiscal first quarter, management expects revenues of $1.68-$1.70 billion, suggesting growth between 6.8% and 8% on a core basis from the year-ago fiscal quarter’s actuals. The Zacks Consensus Estimate for revenues stands at $1.76 billion.
Non-GAAP earnings per share are expected to be $1.29-$1.31. The Zacks Consensus Estimate for earnings is pegged at $1.34 per share.
For fiscal 2023, management anticipates revenues in the band of $6.90-$7 billion, implying growth of 0.8-2.2% on a reported basis and 5-6.5% on a core basis from the respective fiscal 2022 tallies. The Zacks Consensus Estimate for full-fiscal revenues is pegged at $7.19 billion.
Management expects guidance for fiscal 2023 non-GAAP earnings per share of $5.61-$5.69. The Zacks Consensus Estimate for earnings is pegged at $5.48 per share.
Zacks Rank & Other Stocks to Consider
Currently, Agilent carries a Zacks Rank #2 (Buy). Investors interested in the broader Zacks Computer & Technology sector can also consider some other top-ranked stocks like Arista Networks ANET, Airbnb ABNB and Asure Software ASUR. While Arista Networks and Asure Software sport a Zacks Rank #1 (Strong Buy), Airbnb carries a Zacks Rank of 2 at present. You can see the complete list of today’s Zacks #1 Rank stocks here.
Arista Networks has lost 6.4% in the year-to-date period. The long-term earnings growth rate for ANET is currently projected at 17.5%.
Airbnb has lost 42.5% in the year-to-date period. ABNB’s long-term earnings growth rate is currently projected at 20.7%.
Asure Software has lost 8.7% in the year-to-date period. The long-term earnings growth rate for ASUR is currently projected at 23%.
Want the latest recommendations from Zacks Investment Research? Today, you can download 7 Best Stocks for the Next 30 Days. Click to get this free report
Agilent Technologies, Inc. (A) : Free Stock Analysis Report
Asure Software Inc (ASUR) : Free Stock Analysis Report
Arista Networks, Inc. (ANET) : Free Stock Analysis Report
Airbnb, Inc. (ABNB) : Free Stock Analysis Report
