
 Yahoo Finance
 Will Ace Achieve Infocom Limited (SGX:A75) Continue To Underperform Its Industry?

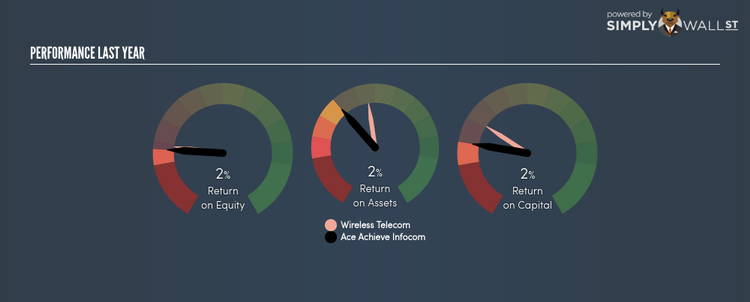
Ace Achieve Infocom Limited (SGX:A75) generated a below-average return on equity of 2.15% in the past 12 months, while its industry returned 12.71%. An investor may attribute an inferior ROE to a relatively inefficient performance, and whilst this can often be the case, knowing the nuts and bolts of the ROE calculation may change that perspective and give you a deeper insight into A75’s past performance. Metrics such as financial leverage can impact the level of ROE which in turn can affect the sustainability of A75’s returns. Let me show you what I mean by this. View our latest analysis for Ace Achieve Infocom
Breaking down ROE — the mother of all ratios
Return on Equity (ROE) is a measure of Ace Achieve Infocom’s profit relative to its shareholders’ equity. For example, if the company invests SGD1 in the form of equity, it will generate SGD0.02 in earnings from this. While a higher ROE is preferred in most cases, there are several other factors we should consider before drawing any conclusions.
Return on Equity = Net Profit ÷ Shareholders Equity
Returns are usually compared to costs to measure the efficiency of capital. Ace Achieve Infocom’s cost of equity is 18.12%. Since Ace Achieve Infocom’s return does not cover its cost, with a difference of -15.97%, this means its current use of equity is not efficient and not sustainable. Very simply, Ace Achieve Infocom pays more for its capital than what it generates in return. ROE can be broken down into three different ratios: net profit margin, asset turnover, and financial leverage. This is called the Dupont Formula:
Dupont Formula
ROE = profit margin × asset turnover × financial leverage
ROE = (annual net profit ÷ sales) × (sales ÷ assets) × (assets ÷ shareholders’ equity)
ROE = annual net profit ÷ shareholders’ equity
Basically, profit margin measures how much of revenue trickles down into earnings which illustrates how efficient the business is with its cost management. Asset turnover shows how much revenue Ace Achieve Infocom can generate with its current asset base. Finally, financial leverage will be our main focus today. It shows how much of assets are funded by equity and can show how sustainable the company’s capital structure is. Since financial leverage can artificially inflate ROE, we need to look at how much debt Ace Achieve Infocom currently has. Currently the debt-to-equity ratio stands at a low 40.72%, which means Ace Achieve Infocom still has headroom to take on more leverage in order to increase profits.

Next Steps:
ROE is a simple yet informative ratio, illustrating the various components that each measure the quality of the overall stock. Ace Achieve Infocom’s below-industry ROE is disappointing, furthermore, its returns were not even high enough to cover its own cost of equity. However, ROE is not likely to be inflated by excessive debt funding, giving shareholders more conviction in the sustainability of returns, which has headroom to increase further. ROE is a helpful signal, but it is definitely not sufficient on its own to make an investment decision.
For Ace Achieve Infocom, I’ve put together three fundamental aspects you should look at:
Financial Health: Does it have a healthy balance sheet? Take a look at our free balance sheet analysis with six simple checks on key factors like leverage and risk.
Future Earnings: How does Ace Achieve Infocom’s growth rate compare to its peers and the wider market? Dig deeper into the analyst consensus number for the upcoming years by interacting with our free analyst growth expectation chart.
Other High-Growth Alternatives : Are there other high-growth stocks you could be holding instead of Ace Achieve Infocom? Explore our interactive list of stocks with large growth potential to get an idea of what else is out there you may be missing!
To help readers see pass the short term volatility of the financial market, we aim to bring you a long-term focused research analysis purely driven by fundamental data. Note that our analysis does not factor in the latest price sensitive company announcements.
The author is an independent contributor and at the time of publication had no position in the stocks mentioned.
