
 Yahoo Finance
 Technical Setups Suggest Stronger Stock Market and Weaker US Dollar
SPX 500
Daily
Prepared by Jamie Saettele, CMT
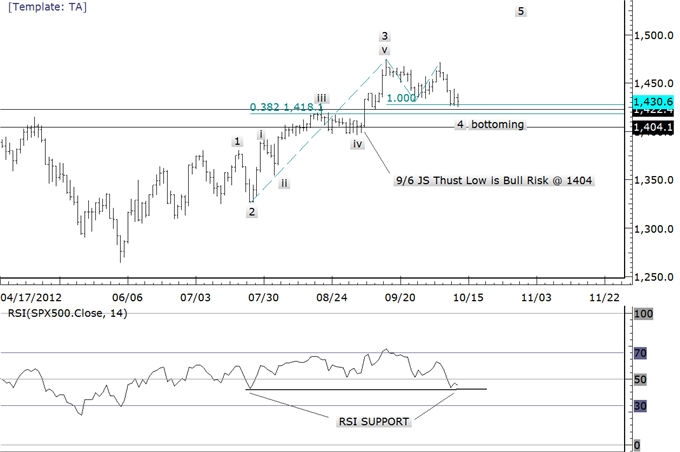
Observation: The SPX 500 traded to 20 day lows for the first time since June 4th and the first time since April 10th when succeeding 20 day highs. The momentum profile remains constructive with daily RSI correcting from above 70 to just below its midpoint. Structural support and measured support are nearby at 1422.40 and 1418.10.
Trading It: The drop into support, from both a price and momentum perspective, has flipped reward/risk in favor of bulls against the 9/6 low of 1404.10. A rally is expected over the next month or two, but probably into a significant top. With that in mind, the reward/risk profile will flip again at new highs.
Dow Jones FXCM Dollar Index (Ticker: USDOLLAR)
Daily
Prepared by Jamie Saettele, CMT
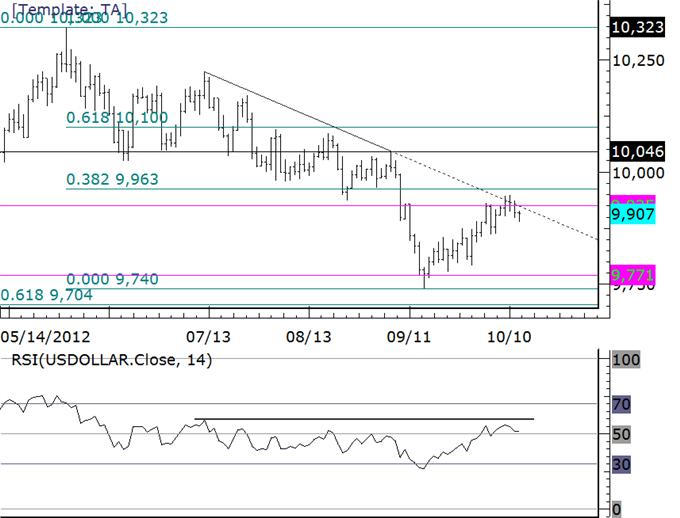
Observation: The USDOLLAR failed at the confluence of trendline resistance, 100% extension of the rally from the low (not shown), 8/23 low, and before the 38.2% retracement of the decline from 10323. Daily RSI has corrected from oversold to just above its midpoint. The slow choppy nature of the advance from the 9/14 low is corrective; probably a triple zigzag.
Trading It: The weight of evidence suggests that the USDOLLAR is headed lower from current levels. 9820 and 9771 are interim supports over the next few weeks but expectations are for fresh lows and a test of the 61.8% retracement of the 9322-10323 rally, at 9704. A daily close above 9949 would negate the bearish outlook.
Euro / US Dollar
Daily
Prepared by Jamie Saettele, CMT
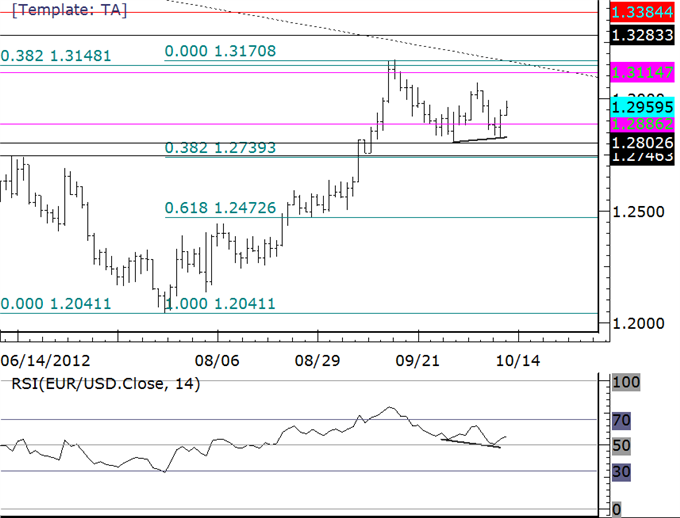
Observation: The EURUSD formed an outside day on Thursday and a bullish RSI reversal signal was triggered Wednesday. Most importantly, price held the first day of the month low.
Trading It: The risk profile is bullish above 12802 for a test of the September high and perhaps even extension towards 13283-13384. Supports are now 12921 and 12887. 13115 may get in the way as interim resistance. 12802 is key as a drop below would shift focus to 12739/55 (9/10 low, June high, and 38.2% of rally from 10241).
Australian Dollar / US Dollar
Daily

Prepared by Jamie Saettele, CMT
Observation: The AUDUSD has been unable to break lower, despite a weak equity market. The break below the 38.2% retracement proved false and divergence with daily RSI is evident. An expanded flat is a valid interpretation for price pattern from the 8/9 high.
Trading It: The market is constructive as long as price is above 10148. 10191 is support and resistance may come in at 10390, 10442, and 10550 although my interpretation of wave structure suggests a return to the highs and potentially an extension towards Fibonacci clusters in the 10700s. 10148 is key as a drop below would shift focus to 9968/79 (6/25 low and 61.8% of rally from 9580).
Euro / Australian Dollar
60 Minute

Prepared by Jamie Saettele, CMT
Observation: The EURAUD formed a daily J Spike on 10/8 and a weekly J Spike this week following a weekly J Thrust! This is an extremely rare long term exhaustion/reversal setup. The structure of the decline from the top and recovery from 12506 suggests impulsive weakness and corrective strength. The 10/5 low is holding as resistance.
Trading It: With the 10/5 low holding as resistance, the EURAUD may not make it to 12702/21. If it does, then reward/risk improves for bears against the high (12832). Objectives in the coming weeks are 12328/65, 12232 and 12068.
Australian Dollar / Swiss Franc
60 Minute
Prepared by Jamie Saettele, CMT
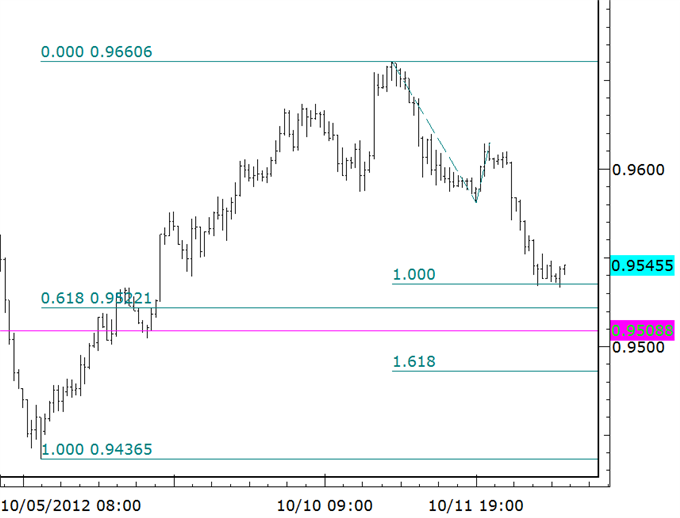
Observation: The AUDCHF formed a daily J Spike on 10/8 and a weekly J Spike this week following a weekly J Thrust! This is an extremely rare long term exhaustion/reversal setup. The structure of the rally from the top and decline from 9661 suggests impulsive strength and corrective weakness. The decline consists of 2 equal legs, which is typical of a correction.
Trading It: AUDCHF long is a cleaner setup than EURAUD short for several reasons. Based purely on levels, risk is less in the AUDCHF than the EURAUD (market – low in AUDCHF < high – market in EURAUD). The AUDCHF has already reached its 100% extension whereas the EURAUD hasn’t. There is of course the added bonus of benefitting from SNB action. This is purely a bonus and is not consideration for the trade however.
--- Written by Jamie Saettele, CMT, Senior Technical Strategist for DailyFX.com
To contact Jamie e-mail jsaettele@dailyfx.com. Follow him on Twitter @JamieSaettele
Subscribe to Jamie Saettele's distribution list in order to receive actionable FX trading strategy delivered to your inbox once a day.
Jamie is the author of Sentiment in the Forex Market.
Meet the DailyFX team in Las Vegas at the annual FXCM Traders Expo, November 2-4, 2012 at the Rio All Suite Hotel & Casino. For additional information regarding the schedule, workshops and accommodations, visit the FXCM Trading Expo website.
DailyFX provides forex news and technical analysis on the trends that influence the global currency markets.
Learn forex trading with a free practice account and trading charts from FXCM.
